黄洁 , 王姣娥
, 王姣娥
HUANG Jie, WANG Jiaoe
收稿日期: 2017-07-5
修回日期: 2018-01-8
网络出版日期: 2018-03-28
版权声明: 2018 地理科学进展 《地理科学进展》杂志 版权所有
基金资助:
作者简介:
作者简介:黄洁(1988-),女,广西桂林人,助理研究员,主要从事交通地理研究,E-mail: huangjie@igsnrr.ac.cn。
展开
摘要
城市轨道交通是居民绿色出行、缓解大城市交通拥堵的重要交通方式。研究大城市地铁客流时间和空间的分布特征,有利于深入了解大城市公共交通的需求,进而制定合理的交通需求管理政策。本文以北京市地铁为例,计算了431万条智能交通卡数据的出行时间和OD矩阵(Origin-Destination Matrix),研究其客流的时间和空间分布特征。研究发现:①全天、早高峰和晚高峰的出行时间分布符合Gamma分布,总体上离城市中心越远,平均出行时间越长;②从市辖区尺度和环路尺度分析,乘客流向和流量均呈现对称性;③从街道尺度来看,居民地铁出行强度的空间不均等性很强。
关键词:
Abstract
Urban railway systems can reduce environmental footprints by residents' commuting and alleviate traffic congestion in mega-cities. Investigating the characteristics of the spatiotemporal distribution of passenger flows is significant in the examination of traffic demand in public transportation systems. Moreover, the study can help decision makers in traffic demand management. Taking the metro system of Beijing as an example, this study calculated the travel time of over 4 million trips and their origin-destination (OD) matrix. In the investigation of the spatiotemporal patterns, we found that: (1) travel time distribution of all trips and trips during the morning and afternoon peaks well fit with Gamma distribution; (2) patterns of passenger flows between districts or ring roads are symmetric; and (3) spatial inequity has been captured from the evaluation of average transit trips per person per day.
Keywords:
大城市人口规模庞大、交通需求巨大,需要高效、便捷的公共交通系统。目前,中国一线城市居民对交通便捷性和通畅性的评价普遍较差,交通需求分布的不合理引发长距离绕行、客流拥堵等问题。因此,宜居城市的建设应包括完善城市公共交通体系的建设,倡导居民绿色出行(张文忠等, 2016)。城市轨道交通是合理利用有限的城市土地资源、解决大城市交通拥堵的重要措施之一。研究大城市地铁客流的时空分布特征,有利于甄别大城市公共交通需求,进而制定合理的交通需求管理政策,实现公交优先发展。
从小世界网络模型提出以来(Watts et al, 1998),轨道交通网络的复杂性成为国内外学者的研究热点。国外学者运用无标度和小世界网络模型分析了30个大城市轨道交通网络的鲁棒性;梳理了波士顿、首尔、北京、南京、上海等城市的网络结构特征参数(Barthélemy, 2010;Derrible et al, 2010)。借鉴国际大城市轨道交通发展的经验和教训,基于可持续发展的框架和公交导向模式,国内学者研究了轨道交通对人口的聚集效应和运输效率,并且初步肯定了轨道交通对城市空间布局的引导和支撑作用(陆化普, 2006; 曹小曙等, 2008; 赵鹏军等, 2016)。
大城市轨道交通普遍采用自动收费系统,智能交通卡已被广泛使用。智能卡数据(Smart Card Data)作为具有地理标识和时刻信息的大数据(龙瀛等, 2012),在数据量、种类和准确性3个方面具备以下特点(Laney, 2001):①通常由大量的便携移动信息感应装置收集(例如,手机、交通卡、出租车GPS装置、SCD数据),数据的收集速度十分迅速,因此其第一个重要特征是数据量大;②大数据的兼容性逐渐提高,多种数据运用在同一研究问题中的方法层出不穷;③由于数据量大和覆盖范围广的特性,大数据具备了准确度高的特征。大数据在地理学研究,尤其在城市交通研究中的应用范围越来越广。例如,利用手机基站数据,研究者对城市道路交通流的分布进行了估计并探究了交通网络结构特征(吴健生等, 2012);利用GPS数据,有学者分析了居民日常活动空间和通勤弹性特征(申悦等, 2013),探究了城市空间形态与居民出行行为的关系(Zheng et al, 2014)。但是,运用手机、出租车等GPS装置的大数据挖掘,很难精确到公共交通出行的模式。
针对城市公共交通系统,国内外学者运用智能交通卡数据(SCD)研究美国、英国、韩国和新加坡的多个城市轨道交通的热点问题,包括城市交通规划、城市空间结构、居民出行与轨道交通的相互作用关系。首先,Utsunomiya等(2006)归纳了SCD挖掘个体出行行为的基本步骤、研究难点及其在交通宏观规划的研究内涵。随后,个体出行行为特征和交通仿真模型的验证一直是SCD数据发掘的热点问题。研究者们通过交通仿真模型发现乘客访问频次最好的站点符合固定的统计分布概率,能够推导少量乘客的社会经济属性和不同群体的出行规律(Hasan et al, 2013; Lee et al, 2014; Manley et al, 2016)。其次,由于城市轨道交通规划与城市空间结构息息相关,因此学者们运用SCD分析客流分布的空间规律,揭示城市空间结构特征,进而解释地铁客流量分布规律与周边建成环境的相互关系(Jang, 2010; Roth et al, 2011; Zhong et al, 2014)。再次,站点尺度的客流量分布成为站点类型划分的重要依据,学者们基于此分析了地铁站的周边建成环境(Choi et al, 2012; Reades et al, 2016; 尹芹等, 2016)。另外,SCD数据也是学者们研究职住平衡的重要支撑,包括职住分布特征、通勤效率优化问题等 (龙瀛等, 2012; Zhou et al, 2014; Long et al, 2015; Ma et al, 2017)。
纵观相关研究,很少有从多空间尺度研究客流的OD矩阵、时空分布特性和居民出行频率。本文将采用大数据分析方法,以北京为例,通过计算431万条智能交通卡数据的出行时间和OD矩阵,研究地铁客流时间和空间的分布特征,为城市公共交通需求管理提供科学依据。
传统的问卷调查能够挖掘OD对的详细信息,常用于城市居民的出行行为和通勤特征的研究,例如:分析个人出行的活动范围,探究出行者的社会经济属性和通勤时间的关系,居民出行行为选择的空间分布(周素红等, 2010; Zhao et al, 2011; Zhou et al, 2013)。赵晖等(2011)从租住房和自购房居民的角度分析了地铁沿线和非地铁沿线的通勤特征。将通勤行为调查和街区土地利用特征相结合,周素红等(2006)从微观视角对宏观的城市空间进行解读。同样基于问卷调查的数据,学者们研究了公共交通可达性与居民出行行为的关系以及“交通网络—出行行为—出行碳排量”的影响机制(曹小曙等, 2013; 罗依等, 2016)。综上所述,深入研究OD信息不仅可以研究城市居民的出行行为特征,还可以研究不同出行方式和城市空间、交通网络和城市发展之间的关系。但是,依赖于问卷调查的OD信息,包含严格的样本选取和具有先验性的发放过程,在时空流特征的研究中具有2个不足之处:第一,发放问卷的人力物力消耗较大,问卷调查的样本大小受到限制;第二,对于地铁客流时空分布,很难获取所有出发点(Origin)和目的地(Destination)的信息,无法了解完整的OD分布。
手机GPS数据通常记录了居民出行的全部轨迹,通常包括了步行、乘坐公共交通或者出租车等过程,但是具体换乘地点不确定。因此GPS数据在居民出行模式的细分上会有一定限制。运用城市公共交通智能交通卡数据进行地铁客流时空分布的研究具有以下3个优势:①数据详实,包括检入和检出地点,为OD矩阵计算提供了精确性的保障;②数据结构简明扼要,数据维度有限,只包含地铁出行的客流;③数据兼容性高,以地铁站点信息为基础,可以兼容其他统计数据进行分析。
因此,本文整理了2014年4月14日北京市政智能交通卡①(①数据来源:北京市交通信息中心),当年的轨道交通线路、站点分布和北京市第六次人口分街道普查数据②(②数据来源:全国第六次人口普查)。地铁智能交通卡数据结构如表1所示,每条数据记录了智能交通卡卡号、检入线路、检入站点、刷卡时间、刷卡次序、检出线路、检出站点和检入时间,并且保存了是否包含终点信息的逻辑判断。值得说明的是,该检票系统以刷卡时间和次序为基准生成数据,即乘客每趟出行记录将生成2条数据记录。这2条数据记录具有相同的卡号、检入线路、检入站点、检入时间,如表1所示。考虑到少量无效数据,北京市地铁SCD包括的OD记录数量等于数据记录总量的40%~50%,与近期研究的数据规律一致(Ma et al, 2017)。以2014年4月14日为例,当天检票系统有超过900万人次,包括使用单次地铁卡的乘客;相当于400多万OD出行记录。该数据量远大于传统抽样调查的样本数量,可以充分反映客流的时空分布特征。因此,431万条OD出行记录将作为本文分析客流时间和空间分布特征的全样本。
表1 北京市智能交通卡刷卡数据示例
Tab. 1 Examples of data records of smart cards in Beijing metro system
| 卡号 | 检入线路 | 检入站点 | 刷卡时间 | 刷卡次序 | 检出线路 | 检出站点 | 检入时间 | 是否包含终点 |
|---|---|---|---|---|---|---|---|---|
| 00000002 | 13 | 33 | 2014/04/14 10:44:00 | 7387916344 | 0 | 0 | 2014/04/14 10:44:00 | 0 |
| 00000002 | 13 | 33 | 2014/04/14 11:22:27 | 7388858193 | 3 | 31 | 2014/04/14 10:44:00 | 1 |
2014年,北京市地铁东延6号线、7号线、14号线,西延15号线,空间范围和网络密度不断增加,总计17条线路,运营总里程达到527 km,包括256个站点,日均客运量达到900万人次。根据北京市统计局数据,北京市分为首都功能核心区、城市功能拓展区、城市发展新区和生态涵养发展区。本文的研究区域定为2014年北京市17条地铁线路和256个站点分布的首都功能核心区、城市功能拓展区和城市发展新区,包括西城、东城、朝阳、海淀、石景山、丰台、昌平、顺义、通州、大兴和房山共11个区(图1)。
图1 研究区域与北京市地铁线路和站点分布图
Fig.1 Map of municipal districts studied and the metro system in Beijing
本文针对431万条记录完整的数据,对北京市地铁客流的时空格局进行系统性分析。从智能交通卡数据中,运用SQL Server逐个统计客流,得到256维双向客流的OD矩阵。时空特征分析的具体方法如下:①时间维度,从全天、早高峰、晚高峰3个时段研究乘客出行时间的分布,并且从站点尺度分析时间分布的空间规律;②空间上,从市辖区尺度、环路尺度、街道尺度和站点尺度,层层深入地分析了其空间特征。
地铁出行作为绿色出行和城市通勤的主要方式之一,探究不同区域居民乘坐地铁的可达性具有重要意义。研究地铁网络可达性是从供给的角度研究城市公共交通出行的空间分布特征(黄晓燕等, 2104)。同时,研究地铁出行的便捷性和可达性也要从需求的角度出发(Huang et al, 2015),了解不同区域居民乘坐地铁出行的频率。对于街道
式中:属于街道
3.1.1 全样本统计规律
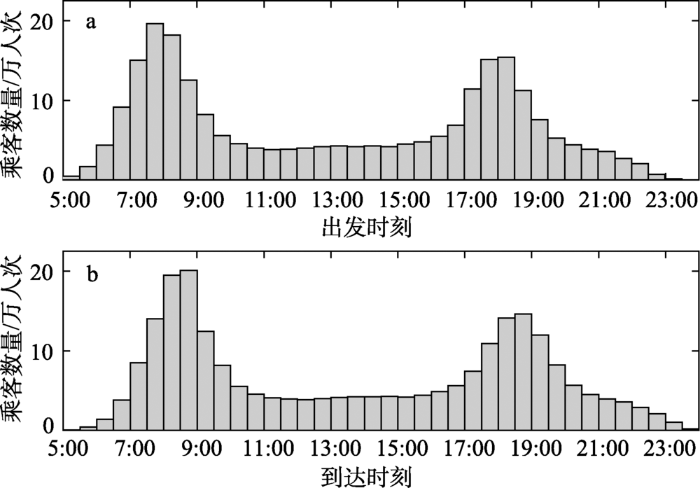
本文以半小时为时间间隔统计进入和离开地铁的乘客数量,进而识别地铁客流量的早晚高峰时段(图2)。据分析,早高峰出现在7点到9点之间,晚高峰出现在17点到20点之间。检入客流的早高峰早于检出客流的早高峰,晚高峰的客流也呈现相同规律,体现了全样本统计的精确性。根据客流量最高峰值的对比,可以发现早高峰的拥挤程度要明显高于晚高峰,这源于晚高峰时段要长于早高峰,同时也说明居民下班出行的时间弹性要略大于上班。此外,10点到17点之间的地铁客流量非常平稳,每半小时约为10万人次左右。
图2 北京市地铁分时段进出乘客数量
Fig.2 Total passengers in every 30 minutes in the Beijing metro system
3.1.2 分时段出行时间分布特征
本文首先统计了400万条数据记录出行时间的基本属性(表2)。根据上文识别的早晚高峰时段,将数据按照以下规则分类:检入时间晚于7点并且检出时间早于9点的记录均被计入早高峰;检入时间晚于17点并且检出时间早于20点的记录均被计入晚高峰。据统计,北京市居民地铁出行的平均时间在40min以内(只考虑在城市轨道交通系统之内的时间),早晚高峰的平均值与全样本的平均值差距在5min以内。从出行时间来看,地铁出行在早晚高峰时段的可靠性很高,主要压力来自于早晚高峰的客流量(图2)。
表2 乘客出行时间的基本属性
Tab.2 Statistic attributes of travel time
| 时段 | 平均值(min) | 标准偏差(min) |
|---|---|---|
| 全天 | 38.9817 | 21.8475 |
| 早高峰 | 35.5971 | 17.3755 |
| 晚高峰 | 33.7665 | 18.6590 |
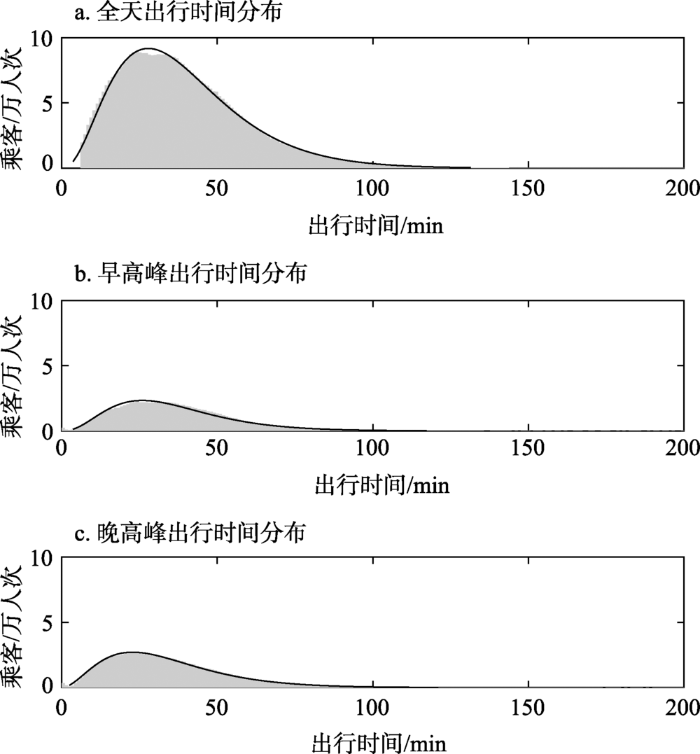
出行时间的统计分布特征具有很高研究价值,能够显示出不同出行时间的具体数量。全天、早高峰和晚高峰乘客出行时间分布均符合Gamma分布(图3),概率密度分布函数(
式中,
图3 乘客出行时间分布及Gamma分布拟合结果
Fig.3 Distribution of travel time and fitting results from Gamma distribution
表3 Gamma分布拟合系数和置信区间
Tab.3 Fitting parameters of Gamma distribution and 95% confidence interval
| 时段 | 形状参数 | 95%置信区间 | 比例参数 | 95%置信区间 | ||
|---|---|---|---|---|---|---|
| 下限 | 上限 | 下限 | 上限 | |||
| 全天 | 3.4945 | 3.4900 | 3.4990 | 11.1551 | 11.1397 | 11.1705 |
| 早高峰 | 3.6509 | 3.6410 | 3.6608 | 9.7629 | 9.7346 | 9.7912 |
| 晚高峰 | 3.0142 | 3.0067 | 3.0217 | 11.2505 | 11.2201 | 11.2810 |
根据乘客的出行时间分布,可以发现北京市地铁内部乘客出行时间主要分布在20~40 min之内,占样本总数的40.81%;只有少部分乘客的出行超过1 h,占14.31%;很少有乘客的出行超过2 h。早高峰乘客出行集中在20~40 min的比例比全样本高,占44.26%;晚高峰时段的这一比例是43.09%。短时间出行的乘客(行程时间小于20 min)主要在早晚高峰时段出行,占短时间出行乘客数量的61.23%。这也进一步论证了早晚高峰时段的平均出行时间略低于全样本,主要原因为:第一,早晚高峰的发车频率远高于其余时段,乘客的站台等待时间相应缩短;第二,通勤乘客的出行步伐一般快于休闲出行的乘客(如购物、娱乐)。另外,长时间出行的乘客趋向于避开早晚高峰,行程时间大于40 min的乘客59.71%都不在早晚高峰出行。
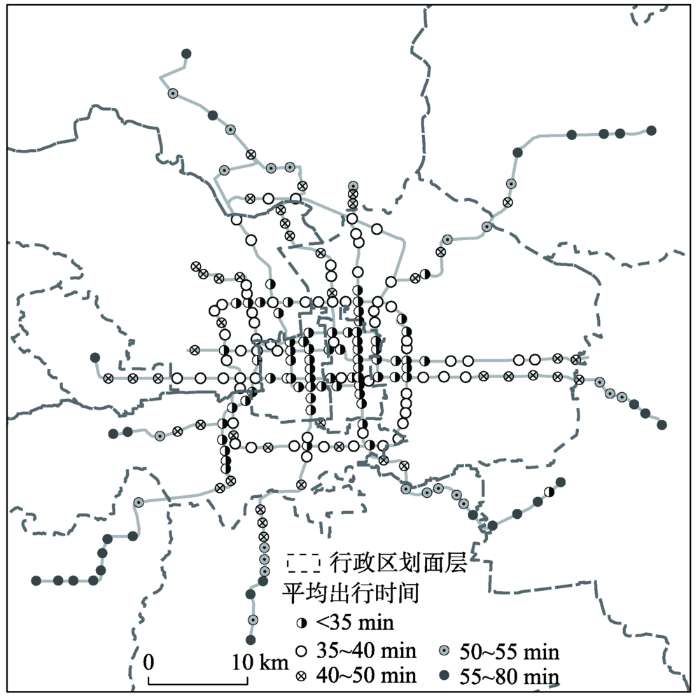
3.1.3 进站点客流的平均出行时间分布特征
基于地铁站点尺度统计每个站点出发乘客的平均出行时间,可以反映乘客的出行空间范围。本文将全样本按照进站点分类,乘客在各站点的平均出行时间如图4所示。总体来说,呈现离市中心越远,出行时间越长的趋势。二环以内,93.55%地铁站点的乘客平均出行时间低于35 min以内。以地铁出行平均3 min一站路计算,二环以内的乘客平均出行范围在12个地铁站点以内,按北京市地铁平均站间距1.5 km(③ 数据来源:www.bjsubway.com),空间范围在18 km以内。二环到三环之间,虽然乘客平均出行范围也是12个地铁站以内,但是其中42.86%地铁站点的乘客平均出行时间在35~40 min以内。三环到四环之间,乘客平均出行时间是35.9 min,49.18%地铁站点的乘客平均出行范围超过12个站点,最大范围达到15个站点。四环到五环之间乘客平均出行时间为42 min,约为14个站点,最大出行时间达到52 min。五环到六环之间乘客平均出行时间达到51 min,约为17个站点,245 km。总的来说,四环以内的平均出行时间增长较慢;五环和六环的出行时间增加明显,增幅分别为5.8 min和9.5 min。
图4 基于进站点的平均出行时间分布
Fig.4 Distribution of average travel time at each metro station
3.2.1 市辖区尺度
人口与各市辖区的地铁客流总量呈现一定的相关性,如图5所示。首先,朝阳区和海淀区的常住人口总数在研究区域内排前2位,均超过350万(2015年北京市统计局数据);这2个区客流总量也排在前2位。其中,朝阳区全天客流超过总客流量的27%,约为230万人次;海淀区的全天地铁客流总量在11个市辖区的第二位,占17.35%,约为140万人次。其次,丰台、昌平和大兴的常住人口数分别为230万、190万和154万,这些辖区的客流分别为85万/d、65万/d、34万/d。再次,顺义、通州、房山和石景山2014年常住人口总数均小于150万人,石景山的常住人口总数只有65万。这些市辖区的客流占比均小于3%。虽然东城区和西城区常住人口数量少于丰台、大兴、昌平等市辖区,但是二者位于首都核心功能区,集中了大量的居民出行目的地,包括居住地、工作地、娱乐休闲场所等。东城和西城区自然集聚了大量的地铁客流。并且,核心区的公路网络常常处于拥堵状态,人们在该区域的出行更需要依赖于地铁。因此,这2个市辖区的日均客流量接近100万人次/d,分别均占北京地铁总客流量的12%。
图5 北京市辖区人口与地铁客流相关性
Fig.5 The correlation between population size and the number of passengers in municipal districts in Beijing
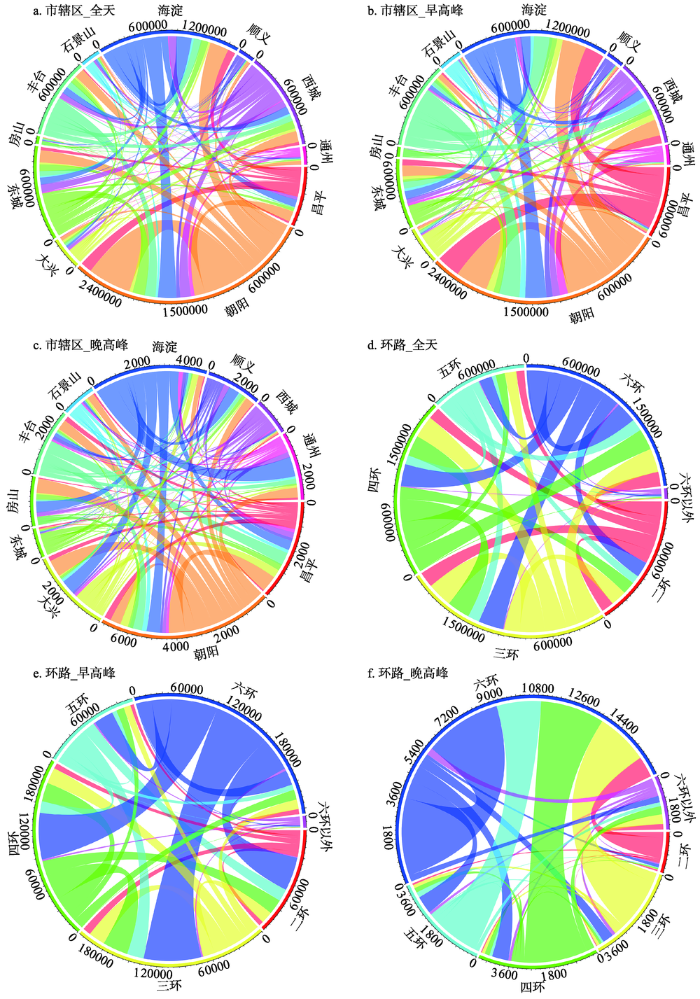
图6a-6c统计了11个市辖区之间的客流分布,时间尺度为全天、早高峰和晚高峰。图中每个辖区外环的颜色表示该辖区流出的客流,圆弧的长度表示该辖区占总乘客数量的百分比,圆弧刻度标注实际客流量。从进出各市辖区客流的进出流量来看,客流分布的对称性很高。例如,全天海淀到朝阳的客流22.9万,朝阳到海淀的客流21.9万;全天东城到朝阳的客流14万,朝阳到东城的客流14.5万。
图6 北京地铁客流的时空分布
Fig.6 Origin-destination (OD) flows of the metro system in Beijing
客流呈现在朝阳、海淀区集聚的特征。11个市辖区的OD流向图中(图6a),朝阳区内部客流是流量最大的OD,达到51万人次。并且,朝阳区与其他市辖区都保持着紧密的联系,9个辖区的最大流入和流出的流向都是朝阳区,按照联系由强到弱的排序为海淀、东城、昌平、西城、丰台、通州、顺义、大兴、石景山。4个辖区与海淀区的客流联系仅弱于朝阳区,按照与海淀区联系由强到弱的排序为昌平、丰台、石景山、顺义。房山区与海淀区保持着最紧密的客流联系,达到2万人次。对比图6a-6c,集聚效应在早高峰时段更为明显。朝阳区早高峰的客流比例是该时段客流的35.04%,比全天高出8.00%;海淀区早高峰的客流比例是该时段客流的23.20%,比全天高出6.00%。
丰台区位于城市功能拓展区,具有一定的区位优势。截至2014年,有5条地铁线路经过丰台区,形成了轨道交通网络,丰台区全天客流达到80万人次。与海淀、朝阳、东城和西城保持着较强的客流联系。但是,同样位于城市功能拓展区的石景山只有1条地铁线路的4个站点,还没有形成城市轨道交通网络。据统计,石景山区全天客流只有20万。各辖区内客流中,石景山区内联系也是最弱的,每天只有4000多人次。
城市发展新区的市辖区地铁客流量相对较少。5个市辖区中,昌平的全天客流量最大,达65万,占当天客流总量的7.86%。虽然这些辖区的客流量较小,但是它们的主要联系方式对北京市地铁线路优化、规划有着重要的意义。昌平和大兴相似,主要联系方向是朝阳、海淀,顺义和通州的客流主要流向朝阳区,与其他各区的联系很弱,房山的主要联系方向是丰台、海淀。另外,这些市辖区的区内地铁客流都很少,表明该区域的城市功能综合性较差。
3.2.2 环路尺度
从环路尺度来看,客流的时空分布呈现潮汐式分布特征;早高峰时段的客流从外环流向内环,晚高峰时段的客流从内环流向外环。客流主要集中在三环、四环和六环之间,且均匀分布,9个OD对都保持在25万/d。早高峰和全天客流在环路尺度的空间分布相似,三环、四环和五环的客流均匀分布在23%~28%之间;二环客流近15%;五环客流总量最少,只占12%。但晚高峰的客流集中主要分布在六环,占45%;三环、四环和五环的客流在13%~17%之间;二环的客流总量最少。早高峰时段,从六环出发至二环、三环、四环是最主要的客流方向,分别为3.7、6.4和5.2万/d。晚高峰时段,六环内部的客流量最大,其次是从三环、四环、五环至六环的客流。
根据环路尺度的分析,可以发现:第一,城市核心区域(二环以内)的地铁客流相对较少,三环和四环是城市地铁客流最为集中、拥堵的区域。第二,相较于市辖区尺度,环路尺度的客流大小对时间维度更敏感。但是,外环客流量高的原因是人口总量大还是人均出行频次高,还需要更精细的计算。
3.2.3 街道尺度
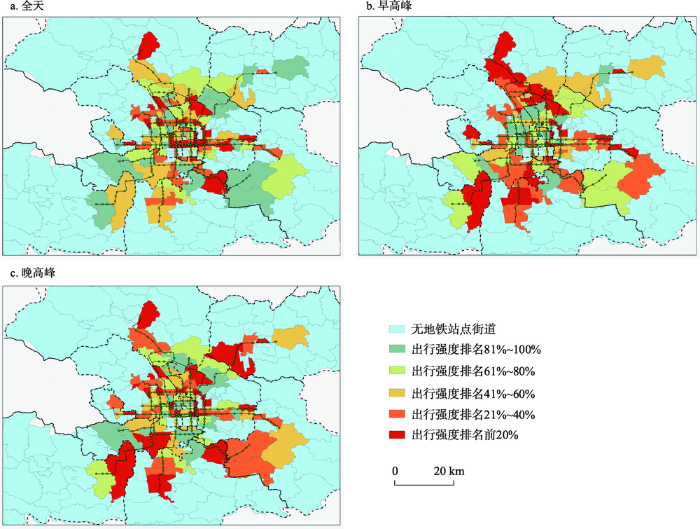
以街道为单元统计,138个街道的空间范围内包含地铁站点,或者居民步行范围内有地铁站点。根据式(1),本文分析了街道居民乘坐地铁的平均出行次数。由于本文只采用了2014年4月14日当天的数据进行计算,因此图7采用了相对分析法,将包含地铁的街道分成5个等级,分析不同区域居民出行对地铁的依赖程度。
图7 基于街道人口的平均乘坐地铁出行强度分析
Fig.7 Analysis of commuting frequencies by transit in street-based communities
全天来看,1号线、2号线沿线位于城市中心区域的街道,居民的出行对地铁出行的依赖性较强。1号线从南礼士路至高碑店地铁站沿线街道和2号线沿线大部分街道(除积水潭、鼓楼大街、安定门和雍和宫沿线街道)均排在地铁出行强度的前20%。首先,城市中心区域道路交通网络易拥堵,乘坐地铁出行的可靠性更高,地铁出行成为居民的首要选择。其次,城市中心区域是办公、居住、学校、休闲娱乐等场所聚集地,吸引了大量城市中心区域以外的客流。再次,城市中心是城市居民和外来游客出行目的地的集中区域,因此该区域的出行强度估算可能包含了外来游客的出行,即略高于实际出行强度。
早高峰和晚高峰时段,街道居民地铁出行强度高的空间分布相似,分散在城市发展新区。早高峰时段,房山区长阳镇、丰台区新村街道、大兴区林校路街道和亦庄地区、昌平线至8号线霍营站沿线的街道、昌平线至13号线北苑站沿线街道的居民地铁出行强度高。晚高峰阶段,城市发展新区南部的地铁出行强度分布与早高峰相似,集中在房山线良乡大学城至4号线丰台南路站沿线街道和大兴线沿线街道;而城市发展新区北部的空间分布与早高峰时段有差异,主要集中在4号线海淀黄庄至安河桥北站沿线街道和15号线国展至顺义站沿线街道。这些街道居民的地铁出行强度在全天的时间维度上看,大部分都不是地铁出行强度最强的街道,说明城市发展新区的居民主要依靠地铁通勤,进而反映出这些地点的居民面临职住分离的问题。相反地,早高峰和晚高峰时段,街道居民地铁出行强度低的空间分布差异较大。早高峰时段,这些街道主要分布在城市中心;而晚高峰时段,居民地铁出行强度低的街道呈散点状分散分布。晚高峰客流要略少于早高峰客流(图2),部分客流没有在晚高峰出行,因此部分街道居民地铁出行强度明显小于早高峰。
本文基于地铁刷卡数据,运用大数据的分析方法,从全天、早高峰和晚高峰时段、市辖区尺度、环路尺度、街道尺度,对北京市地铁客流的时空分布特征进行了系统性分析,研究表明:
第一,北京市地铁客流的流向和流量从市辖区尺度和环路尺度均呈现很强的对称性,同时早晚高峰时间的客流最大值是普通时段的3~4倍。并且,早高峰客流的主要方向是从六环至三环、四环;晚高峰客流的主要方向是三环、四环至六环。
第二,基于街道人口估算人均每天乘坐地铁出行次数,从街道尺度可以发现不同区域居民对地铁的依赖程度差异较大大,空间不均等性较强。市郊居民区对于地铁出行的依赖性最高。目前市郊的地铁网络化还远远不够并且城市功能性不强,因此外环到内环的客流量很大。文章解析了城市发展新区地铁客流的主要联系方向,为北京市轨道交通规划和需求管理提供了准确的方向。
第三,经过不同空间尺度的对比分析,环路尺度、街道尺度相较于市辖区尺度更有助于识别地铁客流时空分布的差异;市辖区尺度和街道尺度有助于分析地铁客流与城市人口分布、居民地铁出行强度。可以发现,空间尺度不断缩小,地铁客流的时空差异越明显。根据不同时段和不同空间尺度研究地铁出行的拥堵压力进行研究,对理解城市轨道交通发展的优势和问题有着深远的意义。
本文采用全样本SCD估计OD矩阵和平均出行强度,结合多尺度分析,为城市地铁客流的时空分布提供了系统的研究。在京津冀交通智能交通卡互联互通后,该方法的应用范围将更为广泛。未来可以基于当前OD矩阵的计算,进一步估计所有乘客的径路网络,研究不同地铁线路的客流量和拥挤程度,更加深入地分析城市轨道交通系统内部客流特征。
The authors have declared that no competing interests exist.
| [1] |
基于GIS的公共交通可达性与居民出行特征 [J].https://doi.org/10.6054/j.jscnun.2013.07.022 URL [本文引用: 1] 摘要
基于广州市现状城市公交线路网数据,借助GIS软件平台,研究社区的公共交通可达性,并基于问卷调查数据,探讨了社区居民出行需求与公共交通供给的匹配情况.结果表明:广州市4个案例社区的公共交通可达时间均呈现出由社区向四周沿公交地铁线路网呈圈层递增扩散的分布特征;一般时段公共交通时间可达性等级较高峰时段明显外扩;公共交通供给基本能满足案例社区的居民公共交通工作及游憩出行,部分区域存在在工作出行最大忍受时耗内公共交通不可达的区域;在购物出行中,存在公共交通供需不平衡的情况.
Transit accessibility and characteristics of residents' transportation based on GIS [J].https://doi.org/10.6054/j.jscnun.2013.07.022 URL [本文引用: 1] 摘要
基于广州市现状城市公交线路网数据,借助GIS软件平台,研究社区的公共交通可达性,并基于问卷调查数据,探讨了社区居民出行需求与公共交通供给的匹配情况.结果表明:广州市4个案例社区的公共交通可达时间均呈现出由社区向四周沿公交地铁线路网呈圈层递增扩散的分布特征;一般时段公共交通时间可达性等级较高峰时段明显外扩;公共交通供给基本能满足案例社区的居民公共交通工作及游憩出行,部分区域存在在工作出行最大忍受时耗内公共交通不可达的区域;在购物出行中,存在公共交通供需不平衡的情况.
|
| [2] |
世界城市地铁发展历程与规律 [J].https://doi.org/10.3321/j.issn:0375-5444.2008.12.003 URL [本文引用: 1] 摘要
基于地铁系统数据统计分析,对地铁建设的空间时序以及网络发育差异进行归纳,结合相关数据推导出地铁规模的匡算模型,并依据地铁系统的属性指标组和网络指标组对世界121个城市地铁系统样本进行聚类分析,将其划分为3个类别,并讨论城市人口规模和城市用地规模对地铁规模的影响,最后对中国53个城市进行地铁规模匡算和等级划分.结果显示,世界城市地铁建设在时空上存在波动性,地区间地铁系统的网络发育不均衡,欧洲和北美洲的地铁网络发育较为成熟,而亚洲和南美洲的地铁网络则有较大的扩展潜力.第一类别地铁系统规模大,网络发育成熟,但仍有较大的扩展潜力,地铁规模与城市用地规模的相关性更强;第二类别地铁系统网络的发育程度较好,但是扩展潜力一般,地铁规模与城市人口规模和城市用地规模的相关性较弱;第三类别地铁系统的规模普遍较小,地铁网络发育处于较低等级水平,地铁网络仍然有很大的成环潜力和结合潜力,地铁规模与城市人口规模的相关性更强.中国城市地铁的匡算规模介于37.6~129.9 km,根据模型的匡算结果中国地铁系统可以划分为4个等级,未来中国的地铁建设仍然有很大潜力.
The evolution of worldwide metro systems: A study on their scales and network indexes [J].https://doi.org/10.3321/j.issn:0375-5444.2008.12.003 URL [本文引用: 1] 摘要
基于地铁系统数据统计分析,对地铁建设的空间时序以及网络发育差异进行归纳,结合相关数据推导出地铁规模的匡算模型,并依据地铁系统的属性指标组和网络指标组对世界121个城市地铁系统样本进行聚类分析,将其划分为3个类别,并讨论城市人口规模和城市用地规模对地铁规模的影响,最后对中国53个城市进行地铁规模匡算和等级划分.结果显示,世界城市地铁建设在时空上存在波动性,地区间地铁系统的网络发育不均衡,欧洲和北美洲的地铁网络发育较为成熟,而亚洲和南美洲的地铁网络则有较大的扩展潜力.第一类别地铁系统规模大,网络发育成熟,但仍有较大的扩展潜力,地铁规模与城市用地规模的相关性更强;第二类别地铁系统网络的发育程度较好,但是扩展潜力一般,地铁规模与城市人口规模和城市用地规模的相关性较弱;第三类别地铁系统的规模普遍较小,地铁网络发育处于较低等级水平,地铁网络仍然有很大的成环潜力和结合潜力,地铁规模与城市人口规模的相关性更强.中国城市地铁的匡算规模介于37.6~129.9 km,根据模型的匡算结果中国地铁系统可以划分为4个等级,未来中国的地铁建设仍然有很大潜力.
|
| [3] |
广州市地铁可达性时空演化及其对公交可达性的影响 [J].https://doi.org/10.11820/dlkxjz.2014.08.008 URL Magsci [本文引用: 1] 摘要
应用GIS 方法,选取2000、2003、2009 和2012 年4 个时间节点,运用复杂网络理论构建了广州市公共交通网络模型,通过对比分析地铁站点与线路加入到公共交通网络中所产生的变化,定量分析地铁网络建设对公共交通可达性的影响,分析地铁发展不同时期内,城市公共交通可达性空间格局的演化,全面探讨地铁建设对城市公共交通可达性的影响,以期为一体化的多模式城市公共交通体系发展决策提供理论支持。结果显示:①广州市地铁网络顺利完成由树状向回路网络的转变,地铁可达性重心与广州市空间扩展方向呼应,呈现出向南、向东迁移特征;②地铁在很大程度上提高了广州城市公交网络可达性,且其改善作用随地铁线路网的增加和回路网络的发育而日益显著;③地铁网络对城市公交可达性格局的影响,打破了常规公交网络圈层式公交可达性格局,逐渐呈现出圈层式加沿地铁线路分布的廊道式格局;④地铁对公交各站点网络可达时间的影响,常规公交站点可达时间变化程度呈现出由地铁线路向外递减的空间分布趋势,当地铁网络发育形成回路网络时,大大地提升公交网络的运营效率,缩短各个站点之间的出行时间。
Spatial-temporal evolution of Guangzhou subway accessibility and its effects on the accessibility of public transportation services [J].https://doi.org/10.11820/dlkxjz.2014.08.008 URL Magsci [本文引用: 1] 摘要
应用GIS 方法,选取2000、2003、2009 和2012 年4 个时间节点,运用复杂网络理论构建了广州市公共交通网络模型,通过对比分析地铁站点与线路加入到公共交通网络中所产生的变化,定量分析地铁网络建设对公共交通可达性的影响,分析地铁发展不同时期内,城市公共交通可达性空间格局的演化,全面探讨地铁建设对城市公共交通可达性的影响,以期为一体化的多模式城市公共交通体系发展决策提供理论支持。结果显示:①广州市地铁网络顺利完成由树状向回路网络的转变,地铁可达性重心与广州市空间扩展方向呼应,呈现出向南、向东迁移特征;②地铁在很大程度上提高了广州城市公交网络可达性,且其改善作用随地铁线路网的增加和回路网络的发育而日益显著;③地铁网络对城市公交可达性格局的影响,打破了常规公交网络圈层式公交可达性格局,逐渐呈现出圈层式加沿地铁线路分布的廊道式格局;④地铁对公交各站点网络可达时间的影响,常规公交站点可达时间变化程度呈现出由地铁线路向外递减的空间分布趋势,当地铁网络发育形成回路网络时,大大地提升公交网络的运营效率,缩短各个站点之间的出行时间。
|
| [4] |
利用公交刷卡数据分析北京职住关系和通勤出行 [J].Identifying commuting pattern of Beijing using bus smart card data [J]. |
| [5] |
城市土地利用与交通系统的一体化规划 [J].https://doi.org/10.3321/j.issn:1000-0054.2006.09.003 URL [本文引用: 1] 摘要
城市土地利用与交通系统的一体化规划是建立城市可持续交通、综合解决城市交通问题的关键。该 文首先对城市土地利用、交通基础设施与交通需求特性的关系及其动态演化机理进行了深入分析。在此基础上,提出了城市形态与交通系统的理想模式,指出实现合 理的城市结构、高密度的土地利用和就业岗位与居住布局协调一致的用地形态,以及保留适当的绿地、公共空间至关重要。最后,提出了实现城市土地利用与交通系 统一体化规划的核心内容、规划的层次划分、规划工作流程和互动反馈的规划方法。
Integrated planning of land-use and transportation systems [J].https://doi.org/10.3321/j.issn:1000-0054.2006.09.003 URL [本文引用: 1] 摘要
城市土地利用与交通系统的一体化规划是建立城市可持续交通、综合解决城市交通问题的关键。该 文首先对城市土地利用、交通基础设施与交通需求特性的关系及其动态演化机理进行了深入分析。在此基础上,提出了城市形态与交通系统的理想模式,指出实现合 理的城市结构、高密度的土地利用和就业岗位与居住布局协调一致的用地形态,以及保留适当的绿地、公共空间至关重要。最后,提出了实现城市土地利用与交通系 统一体化规划的核心内容、规划的层次划分、规划工作流程和互动反馈的规划方法。
|
| [6] |
广州市交通网络对居民出行碳排量的影响: 以聚德、社学、祈福与晓西社区为例 [J].https://doi.org/10.3969/j.issn.1674-7178.2016.05.012 URL [本文引用: 1] 摘要
低碳交通是实现交通可持续性的一种重要途径,其已成为地理学研究的一个重要议题,其中居民出行碳排量研究是其不可或缺的部分.以社区为分析单元,引发交通网络对居民出行碳排量的影响研究.选取广州市4个不同类型交通网络的城市社区作为案例,测量社区居民出行碳排量,并以436个样本数据库为基础,利用AMOS17.0软件建立结构方程模型,试图在社区层面上挖掘“交通网络-出行行为-出行碳排量”的影响机制.结果显示,交通网络α值越大,出行距离越近、出行时长越短、出行碳排量越低;交通网络β值越大,出行时长越短,出行碳排量越低;交通网络γ值越大,出行距离越远、出行时长越长、出行碳排量越高.
Impact of road networks on household travel carbon emissions in Guangzhou: A case study of Jude, Shexue, Qifu and Xiaoxi Communities [J].https://doi.org/10.3969/j.issn.1674-7178.2016.05.012 URL [本文引用: 1] 摘要
低碳交通是实现交通可持续性的一种重要途径,其已成为地理学研究的一个重要议题,其中居民出行碳排量研究是其不可或缺的部分.以社区为分析单元,引发交通网络对居民出行碳排量的影响研究.选取广州市4个不同类型交通网络的城市社区作为案例,测量社区居民出行碳排量,并以436个样本数据库为基础,利用AMOS17.0软件建立结构方程模型,试图在社区层面上挖掘“交通网络-出行行为-出行碳排量”的影响机制.结果显示,交通网络α值越大,出行距离越近、出行时长越短、出行碳排量越低;交通网络β值越大,出行时长越短,出行碳排量越低;交通网络γ值越大,出行距离越远、出行时长越长、出行碳排量越高.
|
| [7] |
基于GPS数据的北京市郊区巨型社区居民日常活动空间 [J].Daily activity space of suburban mega-community residents in Beijing based on GPS data [J]. |
| [8] |
基于手机基站数据的城市交通流量模拟 [J].https://doi.org/10.11821/xb201212007 URL [本文引用: 1] 摘要
基于移动定位数据的城市内社会经济活动特征分析是人类移动性的重要研究内容,而交通流量更是这些特征的基本反映。为还原城市道路网络的使用情况并分析其分布特征,本文从产生交通流量的个体出发,对包含基站位置的手机话单数据进行系统抽样,利用蒙特卡洛方法产生个体的出行起止点,并结合当地道路交通网络求得最短路径,最后估算出一天内道路交通网络上的流量分布。通过分析发现:城市内大部分道路的流量小,使用率低,大部分交通流量集中在小部分主干道路;进一步统计分析可知,当地道路交通流量符合20/80规律,即大约20%的道路承担着80%的交通流量;而对不同类型的道路,流量分布也反映出其在城市道路网络中的地位和作用。此研究对于历史交通流量分布的重现、城市道路交通模式的研究以及基于此的道路网络规划情景模拟都有着重要意义。
Traffic flow simulation based on call detail records [J].https://doi.org/10.11821/xb201212007 URL [本文引用: 1] 摘要
基于移动定位数据的城市内社会经济活动特征分析是人类移动性的重要研究内容,而交通流量更是这些特征的基本反映。为还原城市道路网络的使用情况并分析其分布特征,本文从产生交通流量的个体出发,对包含基站位置的手机话单数据进行系统抽样,利用蒙特卡洛方法产生个体的出行起止点,并结合当地道路交通网络求得最短路径,最后估算出一天内道路交通网络上的流量分布。通过分析发现:城市内大部分道路的流量小,使用率低,大部分交通流量集中在小部分主干道路;进一步统计分析可知,当地道路交通流量符合20/80规律,即大约20%的道路承担着80%的交通流量;而对不同类型的道路,流量分布也反映出其在城市道路网络中的地位和作用。此研究对于历史交通流量分布的重现、城市道路交通模式的研究以及基于此的道路网络规划情景模拟都有着重要意义。
|
| [9] |
基于客流特征的北京地铁站点类型识别 [J].https://doi.org/10.18306/dlkxjz.2016.01.014 URL [本文引用: 1] 摘要
地铁站点是城市各种社会经济活动的关键节点,不同类型的地铁站点在城市中的区域条件、交通功能、土地利用类型等方面均存在差异,科学的站点分类有助于了解城市功能分区及评价轨道交通基础设施建设状况.本文基于2013年3月份14天工作日地铁刷卡客流量数据,运用引入客流特征的时间序列聚类方法,对北京市195个地铁站点进行分类.研究表明:①地铁站点客流量存在时空差异,也是城市功能分区时空差异的表现之一.②通过引入客流特征的时间序列方法,将地铁站点分为居住导向型、就业导向型、职住错位型、错位偏居住型、错位偏就业型、混合型、综合型及其他型8种不同类型.③利用地铁站点客流量数据,是将空间行为和实体空间进行关联比较的有效途径.
Classification of subway stations in Beijing based on passenger flow characteristics [J].https://doi.org/10.18306/dlkxjz.2016.01.014 URL [本文引用: 1] 摘要
地铁站点是城市各种社会经济活动的关键节点,不同类型的地铁站点在城市中的区域条件、交通功能、土地利用类型等方面均存在差异,科学的站点分类有助于了解城市功能分区及评价轨道交通基础设施建设状况.本文基于2013年3月份14天工作日地铁刷卡客流量数据,运用引入客流特征的时间序列聚类方法,对北京市195个地铁站点进行分类.研究表明:①地铁站点客流量存在时空差异,也是城市功能分区时空差异的表现之一.②通过引入客流特征的时间序列方法,将地铁站点分为居住导向型、就业导向型、职住错位型、错位偏居住型、错位偏就业型、混合型、综合型及其他型8种不同类型.③利用地铁站点客流量数据,是将空间行为和实体空间进行关联比较的有效途径.
|
| [10] |
|
| [11] |
职住分离的度量方法与空间组织特征: 以北京市轨道交通对职住分离的影响为例 [J].https://doi.org/10.11820/dlkxjz.2011.02.009 URL Magsci [本文引用: 1] 摘要
基于问卷调查获取的万份调查数据,构建了以通勤时间/距离为基础数据的职住分离度量模型,即基于频数分布法的通勤时间/距离和基于不同时段/区段范围内居民分布结构的“职住分离强度指数”。根据上述判别模型与计算结果,发现:①各样本区居民通勤时间普遍增加,城市外围区轨道交通沿线居民通勤时间多数集中在40分钟以上,自购居民的通勤时间明显高于租住居民。②与非地铁沿线居民相比,轨道沿线居民的职住距离较高,以居住为主的大型外围区居民的通勤距离明显偏大。③郊区居民职住分离强度相对较大,通勤时间及其变化在远郊区、中心城区以及不同的样本区之间具有较为复杂的差异。④基于差异,简要分析了样本特殊性形成与发展的机理,并简要透析出与房地产价格、轨道交通、以及城市功能区之间的关系。
Measurement method and characteristics of spatial organization for jobs-housing misbalance: A case study of the effects of metro systems on jobs-housing misbalance in Beijing [J].https://doi.org/10.11820/dlkxjz.2011.02.009 URL Magsci [本文引用: 1] 摘要
基于问卷调查获取的万份调查数据,构建了以通勤时间/距离为基础数据的职住分离度量模型,即基于频数分布法的通勤时间/距离和基于不同时段/区段范围内居民分布结构的“职住分离强度指数”。根据上述判别模型与计算结果,发现:①各样本区居民通勤时间普遍增加,城市外围区轨道交通沿线居民通勤时间多数集中在40分钟以上,自购居民的通勤时间明显高于租住居民。②与非地铁沿线居民相比,轨道沿线居民的职住距离较高,以居住为主的大型外围区居民的通勤距离明显偏大。③郊区居民职住分离强度相对较大,通勤时间及其变化在远郊区、中心城区以及不同的样本区之间具有较为复杂的差异。④基于差异,简要分析了样本特殊性形成与发展的机理,并简要透析出与房地产价格、轨道交通、以及城市功能区之间的关系。
|
| [12] |
我国大城市交通拥堵特征与国际治理经验借鉴探讨 [J].Big city traffic characteristics and international management experience and enlightenment [J]. |
| [13] |
基于T-GIS的广州市居民日常活动时空关系 [J].Spatio-temporal pattern of residents' daily activities based on T-GIS: A case study in Guangzhou, China [J]. |
| [14] |
基于居民通勤行为分析的城市空间解读: 以广州市典型街区为案例 [J].https://doi.org/10.3321/j.issn:0375-5444.2006.02.007 URL [本文引用: 1] 摘要
行为研究是近年来人文地理研究中颇受关注的领域之一,对微观行为进行宏观归纳,进而解释人地关系是提升其理论价值的重要方向之一。GIS的应用在很大程度上解决了研究手段上的瓶颈问题。本文将GIS与传统的研究方法相结合,构建基于智能图的微观行为调查方法体系,并利用GIS实现微观行为及空间感知的宏观空间模拟,探讨基于城市居民通勤行为分析的空间解读方法。同时,将该方法运用于广州市,选择具有典型意义的街区进行研究。通过调查,获取典型街区实体空间信息、被调查者社会属性、通勤行为空间和对通勤沿路相关实体要素的感知等信息,进行分析与模拟。一方面,分析认为,居民通勤行为空间在很大程度上反映实体空间的现状及其演化,同时,与社会空间有一定的关系;另一方面,以调查获取的数据为实验基础,利用GIS进行基于个体对实体空间感知的宏观效果模拟实验,该方法能较好地解读实体空间的特征和存在的主要问题,并具有一定的可拓展性。
The impact of commuters' travel pattern on urban structure: A case study in some typical communities in Guangzhou [J].https://doi.org/10.3321/j.issn:0375-5444.2006.02.007 URL [本文引用: 1] 摘要
行为研究是近年来人文地理研究中颇受关注的领域之一,对微观行为进行宏观归纳,进而解释人地关系是提升其理论价值的重要方向之一。GIS的应用在很大程度上解决了研究手段上的瓶颈问题。本文将GIS与传统的研究方法相结合,构建基于智能图的微观行为调查方法体系,并利用GIS实现微观行为及空间感知的宏观空间模拟,探讨基于城市居民通勤行为分析的空间解读方法。同时,将该方法运用于广州市,选择具有典型意义的街区进行研究。通过调查,获取典型街区实体空间信息、被调查者社会属性、通勤行为空间和对通勤沿路相关实体要素的感知等信息,进行分析与模拟。一方面,分析认为,居民通勤行为空间在很大程度上反映实体空间的现状及其演化,同时,与社会空间有一定的关系;另一方面,以调查获取的数据为实验基础,利用GIS进行基于个体对实体空间感知的宏观效果模拟实验,该方法能较好地解读实体空间的特征和存在的主要问题,并具有一定的可拓展性。
|
| [15] |
Spatial networks [J]. |
| [16] |
An analysis of metro ridership at the station-to-station level in Seoul [J].https://doi.org/10.1007/s11116-011-9368-3 URL [本文引用: 1] 摘要
While most aggregate studies of transit ridership are conducted at either the stop or the route level, the present study focused on factors affecting Metro ridership in the Seoul metropolitan area at the station-to-station level. The station-to-station analysis made it possible to distinguish the effect of origin factors on Metro ridership from that of destination factors and to cut down the errors caused by the aggregation of travel impedance-related variables. After adopting two types of direct-demand patronage forecasting models, the multiplicative model and the Poisson regression model, the former was found to be superior to the latter because it clearly identified the negative influences of competing modes on Metro ridership. Such results are rarely found with aggregate level analyses. Moreover, the importance of built environment in explaining Metro demand was confirmed by separating built environment variables for origin and destination stations and by differentiating ridership by the time of day. For morning peak hours, the population-related variables of the origin stations played a key role in accounting for Metro ridership, while employment-related variables prevailed in destination stations. In evening peak hours, both employment- and population-related variables were significant in accounting for the Metro ridership at the destination station. This showed that a significant number of people in the Seoul metropolitan area appear to take various non-home-based trips after work, which is consistent with the results from direct household travel surveys.
|
| [17] |
The complexity and robustness of metro networks [J].https://doi.org/10.1016/j.physa.2010.04.008 URL [本文引用: 1] 摘要
Transportation systems, being real-life examples of networks, are particularly interesting to analyze from the viewpoint of the new and rapidly emerging field of network science. Two particular concepts seem to be particularly relevant: scale-free patterns and small-worlds. By looking at 33 metro systems in the world, this paper adapts network science methodologies to the transportation literature, and offers one application to the robustness of metros; here, metro refers to urban rail transit with exclusive right-of-way, whether it is underground, at grade or elevated. We find that most metros are indeed scale-free (with scaling factors ranging from 2.10 to 5.52) and small-worlds; they show atypical behaviors, however, with increasing size. In particular, the presence of transfer-hubs (stations hosting more than three lines) results in relatively large scaling factors. The analysis provides insights/recommendations for increasing the robustness of metro networks. Smaller networks should focus on creating transfer stations, thus generating cycles to offer alternative routes. For larger networks, few stations seem to detain a certain monopole on transferring, it is therefore important to create additional transfers, possibly at the periphery of city centers; the Tokyo system seems to remarkably incorporate these properties.
|
| [18] |
Spatiotemporal patterns of urban human mobility [J].https://doi.org/10.1007/s10955-012-0645-0 URL [本文引用: 1] 摘要
The modeling of human mobility is adopting new directions due to the increasing availability of big data sources from human activity. These sources enclose digital information about daily visited...
|
| [19] |
Circuity in urban transit networks [J].https://doi.org/10.1016/j.jtrangeo.2015.09.004 URL [本文引用: 1] 摘要
This paper investigates the circuity of transit networks and examines auto mode share as a function of circuity and accessibility to better understand the performance of urban transit systems. We first survey transit circuity in the Minneapolis t. Paul, Minnesota, region in detail, comparing auto and transit trips. This paper finds that circuity can help to explain mode choices of commuters. We then investigate thirty-five additional metropolitan areas in the United States. The results from these areas show that transit circuity exponentially declines as travel time increases. Moreover, we find that the circuity of transit networks is higher than that of road networks, illustrating how transit systems choose to expand their spatial coverage at the expense of directness and efficiency in public transportation networks. This paper performs a regression analysis that suggests the circuity of transportation networks can estimate transit accessibility, which helps to explain mode share.
|
| [20] |
2010. Travel time and transfer analysis using transit smart card data [J].https://doi.org/10.3141/2144-16 URL [本文引用: 1] 摘要
Automatic fare collection systems using smart card technology have become popular because they provide an efficient and cost-saving alternative to the manual fare collection method. In 2004, the City of Seoul, South Korea, introduced a smart card-based transit fare scheme, which was a distance-based, integrated fare collection and calculation system. Over the years, the system was extended twice and now can provide detailed information about public transit use in the region. This information includes each trip's boarding and alighting times and locations, as well as the connected trip chains with transfers. This paper examines possibilities for using such data for transportation planning application. First, a process to generate a travel time map is presented. For this, more than 100 million trip data are used to estimate travel times among stops. It is also demonstrated that transfer data can be readily obtainable because the on- and off-boarding information reside in the data set. Although transfers are considered to be important information for public transit planning, it has not been easy to collect such information. This study illustrates that transfer data can be used to locate the critical transfer points that need improvement. It is also demonstrated that a simple data query can quickly identify these locations. In addition, transfer trip patterns between two zones are analyzed, which provides meaningful information about passengers' transfer location choice.
|
| [21] |
3D data management: Controlling data volume, velocity, and variety [R]. |
| [22] |
Trip purpose inference using automated fare collection data [J].https://doi.org/10.1007/s12469-013-0077-5 URL [本文引用: 1] 摘要
In this paper, we exploit the extensive smart card transaction data for deriving useful information about transit passenger behavior, namely trip purpose or activity. We show how the automated fare collection data (e.g., smart card) can be used to infer trip purpose and to reveal travel patterns in an urban area. A case study demonstrates the process of trip purpose inference based on smart card data from Metro Transit in the Minneapolis/St. Paul metropolitan area.
|
| [23] |
Discovering functional zones using bus Smart Card Data and Points of Interest in Beijing [M]. |
| [24] |
Understanding commuting patterns using transit smart card data [J].https://doi.org/10.1016/j.jtrangeo.2016.12.001 URL [本文引用: 2] 摘要
Commuting reflects the long-term travel behavior of people and significantly impacts urban traffic congestion and emission. Recent advances in data availability provide new opportunities to understand commuting patterns efficiently and effectively. This study develops a series of data mining methods to identify the spatiotemporal commuting patterns of Beijing public transit riders. Using one-month transit smart card data, we measure spatiotemporal regularity of individual commuters, including residence, workplace, and departure time. This data could be used to identify transit commuters by leveraging spatial clustering and multi-criteria decision analysis approaches. A disaggregated-level survey is performed to demonstrate the effectiveness of the proposed methods with a commuter identification accuracy that reaches as high as 94.1%. By visualizing the spatial distribution of the homes and workplaces of transit commuters, we determine a clear disparity between commuters and noncommuters and confirm the existence of job ouse imbalance in Beijing. The findings provide useful insights for policymakers to shape a more balanced job ousing relationship by adjusting the monocentric urban structure of Beijing. In addition, the extracted individual-level commuting patterns can be used as valuable information for public transit network design and optimization. These strategies are expected to reduce car dependency, shorten excess commute, and alleviate traffic congestion.
|
| [25] |
Spatiotemporal variation in travel regularity through transit user profiling [J].
New smart card datasets are providing new opportunities to explore travel behaviour in much greater depth than anything accomplished hitherto. Part of this quest involves measuring the great array of regular patterns within such data and explaining these relative to less regular patterns which have often been treated in the past as noise. Here we use a simple method called DBSCAN to identify clusters of travel events associated with particular individuals whose behaviour over space and time is captured by smart card data. Our dataset is a sequence of three months of data recording when and where individual travellers start and end rail and bus travel in Greater London. This dataset contains some 640 million transactions during the period of analysis we have chosen and it enables us to begin a search for regularities at the most basic level. We first define measures of regularity in terms of the proportions of events associated with temporal, modal (rail and bus), and service regularity clusters, revealing that the frequency distributions of these clusters follow skewed distributions with different means and variances. The analysis then continues to examine how regularity relative to irregular travel across space, demonstrating high regularities in the origins of trips in the suburbs contrasted with high regularities in the destinations in central London. This analysis sets the agenda for future research into how we capture and measure the differences between regular and irregular travel which we discuss by way of conclusion.
|
| [26] |
Finding pearls in London's Oysters [J].https://doi.org/10.2148/benv.42.3.365 URL [本文引用: 1] 摘要
Public transport is perhaps the most significant component of the contemporary smart city currently being automated using sensor technologies that generate data about human behaviour. This is largely due to the fact that the travel associated with such transport is highly ordered. Travellers move collectively in closed vehicles between fixed stops and their entry into and from the system is unambiguous and easy to automate using smart cards. Flows can thus be easily calculated at specific station locations and bus stops and within fine temporal intervals. Here we outline work we have been doing using a remarkable big data set for public transport in Greater London generated from the Oyster Card, the smart card which has been in use for over 13 years. We explore the generic properties of the Tube and Overground rail system focusing first on the scale and distribution of the flow volumes at stations, then engaging in an analysis of temporal flows that can be decomposed into various patterns using principal components analysis (PCA) which smoothes out normal fluctuations and leaves a residual in which significant deviations can be tracked and explained. We then explore the heterogeneity in the data set with respect to how travel behaviour varies over diff erent time intervals and suggest how we can use these ideas to detect and manage disruptions in the system.
|
| [27] |
Structure of urban movements: Polycentric activity and entangled hierarchical flows [J].https://doi.org/10.1371/journal.pone.0015923 URL PMID: 3017563 [本文引用: 1] 摘要
The spatial arrangement of urban hubs and centers and how individuals interact with these centers is a crucial problem with many applications ranging from urban planning to epidemiology. We utilize here in an unprecedented manner the large scale, real-time 'Oyster' card database of individual person movements in the London subway to reveal the structure and organization of the city. We show that patterns of intraurban movement are strongly heterogeneous in terms of volume, but not in terms of distance travelled, and that there is a polycentric structure composed of large flows organized around a limited number of activity centers. For smaller flows, the pattern of connections becomes richer and more complex and is not strictly hierarchical since it mixes different levels consisting of different orders of magnitude. This new understanding can shed light on the impact of new urban projects on the evolution of the polycentric configuration of a city and the dense structure of its centers and it provides an initial approach to modeling flows in an urban system.
|
| [28] |
Potential uses of transit smart card registration and transaction data to improve transit planning [J].https://doi.org/10.3141/1971-16 URL [本文引用: 1] 摘要
New automated fare collection systems being implemented on urban rail and bus transit systems offer the potential of tapping a rich source of customer usage data to improve transit planning. This is especially true of transit systems that offer smart cards as a payment option allowing long-term individual travel behaviors to be tracked and analyzed. This paper presents an initial analysis of the access and usage patterns of Chicago Transit Authority, Illinois, smart card holders during September 2004. The types of analyses that can be conducted with smart card registration and transaction data are discussed, the potential difficulties encountered in conducting such analyses are described, and recommendations are offered for improvement and expansion of the use of smart card data sets. The findings reported focus on walking access distances, frequency and consistency of daily travel patterns, and variability of smart card customer behaviors by residential area.
|
| [29] |
Collective dynamics of 'small-world' networks [J].https://doi.org/10.1038/30918 URL [本文引用: 1] |
| [30] |
Impact of the jobs-housing balance on urban commuting in Beijing in the transformation era [J].https://doi.org/10.1016/j.jtrangeo.2009.09.008 URL [本文引用: 1] 摘要
This empirical study examines the impact of the jobs-housing balance on individual commuting time in Beijing in the period of transformation of the Chinese economy and society. The results of the analysis show that the jobs-housing balance has a statistically significant association with a worker’s commuting time when the factors of transport accessibility, population density and worker’s socioeconomic characteristics are controlled. The higher the jobs-housing balance, the shorter the worker’s commuting time. The finding suggests that the jobs-housing balance still has significant implications for commuting time, although the recent market-oriented reforms in housing are changing the jobs-housing balance in the danwei system that prevailed in the socialist era. As the housing markets are imperfect, with strong government intervention in Beijing, the finding implies that the co-location hypothesis – which believes development management would create ‘barriers’ to a jobs-housing balance and increase commuting time – needs to be rethought before it can be generalized and applied to China’s cities. The results of the analysis also show that the workers living in danwei housing still have shorter commuting time. The finding indicates that the housing marketization is likely to induce a local jobs-housing imbalance and thereby increase commuting time. In this sense, a deterioration in the jobs-housing imbalance and increased commuting time in Beijing may owe much to the adoption of market-based housing supply.
|
| [31] |
Characterizing urban structure using taxi GPS data [M]//Rasouli S, Timmermans H J P. |
| [32] |
Detecting the dynamics of urban structure through spatial network analysis [J].https://doi.org/10.1080/13658816.2014.914521 URL [本文引用: 1] 摘要
Urban spatial structure in large cities is becoming ever more complex as populations grow in size, engage in more travel, and have increasing amounts of disposable income that enable them to live more diverse lifestyles. These trends have prominent and visible effects on urban activity, and cities are becoming more polycentric in their structure as new clusters and hotspots emerge and coalesce in a wider sea of urban development. Here, we apply recent methods in network science and their generalization to spatial analysis to identify the spatial structure of city hubs, centers, and borders, which are essential elements in understanding urban interactions. We use a ‘big’ data set for Singapore from the automatic smart card fare collection system, which is available for sample periods in 2010, 2011, and 2012 to show how the changing roles and influences of local areas in the overall spatial structure of urban movement can be efficiently monitored from daily transportation. In essence, we first construct a weighted directed graph from these travel records. Each node in the graph denotes an urban area, edges denote the possibility of travel between any two areas, and the weight of edges denotes the volume of travel, which is the number of trips made. We then make use of (a) the graph properties to obtain an overall view of travel demand, (b) graph centralities for detecting urban centers and hubs, and (c) graph community structures for uncovering socioeconomic clusters defined as neighborhoods and their borders. Finally, results of this network analysis are projected back onto geographical space to reveal the spatial structure of urban movements. The revealed community structure shows a clear subdivision into different areas that separate the population’s activity space into smaller neighborhoods. The generated borders are different from existing administrative ones. By comparing the results from 302years of data, we find that Singapore, even from such a short time series, is developing rapidly towards a polycentric urban form, where new subcenters and communities are emerging largely in line with the city’s master plan. To summarize, our approach yields important insights into urban phenomena generated by human movements. It represents a quantitative approach to urban analysis, which explicitly identifies ongoing urban transformations.
|
| [33] |
Commuting efficiency in the Beijing metropolitan area: An exploration combining smartcard and travel survey data [J].https://doi.org/10.1016/j.jtrangeo.2014.09.006 URL [本文引用: 1] 摘要
Using Beijing as an example, this research demonstrates that smartcard data can be used to (a) assemble the required data for excess commuting studies, and (b) visualise related results. Based on both smartcard and household travel survey data, we find that the theoretical minimum commute is considerably lower for bus users than for car users in Beijing. This suggests that there is a greater inter-mixing of jobs–housing functions (i.e., a better jobs–housing balance) associated with users of that mode compared to the corresponding land-use arrangement for car users, who locate further from the central area (Tian’anmen) than bus users. The commuting range for car users is 9.4km greater than for bus users. Excess commuting is slightly higher for bus users (69.5%) than for car users (68.8%). Commuting capacity values are slightly lower for car users than for bus users, implying that car users consume less of their available commuting resources overall than bus users, albeit only marginally.
|
| [34] |
Spatial analysis of commuting mode choice in Guangzhou, China [J].https://doi.org/10.1007/s11769-012-0569-2 URL [本文引用: 1] |

/
| 〈 |
|
〉 |

