Transfer of carbon emissions embodied in inter-regional trade is an important reason that leads to inter-regional carbon leakage and inequity of regional carbon emission reduction responsibility, which has significant impact on global carbon emission pattern and carbon emission reduction effect. Therefore, studying the spatial-temporal evolution pattern and internal driving mechanism of carbon emission transfer and developing corresponding optimization policies are of great practical significance to improving the overall efficiency of carbon emission reduction and the comprehensive regional economic and ecological benefit, which has attracted extensive attention of scholars, and has gradually become one of the key issues of regional sustainable development and ecological economic research. This research systematically reviewed relevant studies about transfer of carbon emissions embodied in inter-regional trade in China and abroad, with special emphasis on summarizing the research progress and their application, as well as the future research directions of transfer of carbon emissions embodied in inter-regional trade. These directions include strengthening collaborative research between transfer of carbon emissions embodied in international and inter-provincial trade, revealing the dynamic driving forces and driving mechanism of transfer of carbon emissions embodied in inter-regional trade, and exploring innovative carbon emission transfer reduction mechanisms that are based on the shared production and consumption accounting principle.
Keywords:inter-regional trade
;
spatial transfer of carbon emissions
;
inter-regional input and output
;
carbon leakage
;
progress and prospects
LIFujia. Progress and prospects of research on transfer of carbon emissions embodied in inter-regional trade[J]. Progress in Geography, 2018, 37(10): 1303-1313 https://doi.org/10.18306/dlkxjz.2018.10.001
1 引言
近年来,温室气体排放引起的全球气候变化,已日渐威胁到全球生态平衡和人类社会的可持续发展(Peters et al, 2011; Dong et al, 2017)。控制CO2等温室气体的排放,已成为当前人类应对全球气候变化的重要任务(李富佳等, 2012; Li et al, 2017)。目前,核算区域碳排放的方法一般采用《联合国气候变化框架公约》中提出的生产责任法,即因生产、出口和调出产品而排放的CO2包含在一个区域的碳排放账户里,但因进口和调入引起的碳排放却被排除在外。然而,随着区域间贸易,经济发达地区会通过区际贸易从经济落后地区调入高碳排放的产品,从而使经济发达地区表面上实现了碳减排,实际上却是以经济落后地区碳排放量增长为代价。而落后地区为了经济发展,必须长时间生产此类产品。发达地区虽然减排成效显著,但却加重了欠发达地区的碳减排压力。这种严重的双边贸易过程中隐含的碳转移问题既存在于国家之间,也广泛存在于经济体系相对独立的不同行政单元之间。区际碳排放转移直接导致了区域间在整体上不但没有实现碳减排,反而加剧了彼此碳减排权责的不公平、低效率和高成本。区际碳隐含转移问题对区域碳排放格局和碳减排效果影响重大,是造成区域间减排压力转嫁、整体减排效果抵消、碳排放净转出区经济增长负担加重和产业结构升级转型困难等问题的重要原因之一(Miller et al, 2009; 李富佳等, 2015)。
在微观方面,也有大量学者以单一的国家或地区为案例,对碳排放跨区域转移量进行核算。其结论均证明了区域间贸易引起的碳排放迁移量,在区域碳排放总量中往往占据着不可忽视的比重,对单个国家和地区的碳排放总量和构成具有显著影响(Munoz et al, 2010; Bushnell et al, 2012; Cahill et al, 2012)。如Schaeffer等(1996)对巴西 1970-1993 年非能源商品进出口中隐含的碳排放量进行了评估,证明巴西1980年以来一直保持着较高的净出口隐含碳排放量,而1990 年这部分碳排放量已占到巴西总碳排放量的11.4%。而Sánchez-Chóliz等(2004)对西班牙的研究也同样表明,西班牙在进口和出口贸易中隐含的碳排放量分别占到了总排放量的36%和37%。同样,Ståhls等(2011)对芬兰1991-2005年的国际贸易分析也显示,芬兰几乎所有的碳排放都是由于出口产品造成的。也就是说,碳排放净出口国在出口贸易过程中,承担了其他国家消费的碳排放;而碳排放净进口国家则在进口贸易中将自身所应承担的部分碳排放量转移到了其产品供应国。
这些研究成果表明,无论从全球格局还是地区发展的角度看,碳排放转移对区域碳排放量的影响不但范围广、时间长而且程度深,是研究区域碳排放问题必须考虑的重要影响因子。如果割裂区际联系,单纯地考虑某一区域范围内的碳排放问题,既不科学,也有失公平。这一点,在发达国家和发展中国家之间的碳排放转移研究成果上,得到了最明显的印证(Tolmasquim et al, 2003)。中国作为全球最大的发展中国家和全球第一贸易大国,其贸易碳转移问题,对本国乃至全球的碳排放格局都影响重大。因此,针对中国进出口贸易中隐含碳排放空间转移问题的研究,近年来已成为区际碳排放转移研究的一大热点,引起了全球同领域学者的广泛关注。
3 中国的贸易隐含碳排放转移研究进展
3.1 国际贸易
中国是全球最大的碳排放国,也是国际贸易大国,近年来国内外学者针对中国及其各省区对外进出口贸易隐含的碳排放空间转移研究日渐增多(Andersson, 2018)。对Web of Science的搜索发现,1981-2017年,关于中国国际贸易隐含碳排放的相关研究达到317篇,占国际贸易隐含碳排放研究的85%,并从2010年开始呈现快速增长的态势,2017年相关的研究论文高达116篇(Zhang et al, 2017)。而针对中国国际贸易隐含碳转移的研究成果再次说明,中国是承受全球碳泄漏最为严重的国家之一,区际贸易隐含碳转移,也是造成中国成为全球碳排放第一大国的关键原因之一(齐晔等, 2008; 潘安, 2017)。如,Shui等(2006)通过研究中美之间国际贸易造成的碳排放空间迁移变化发现,1997-2003年7%~14%的中国CO2排放是由于美国消费需求扩大而引起中国相关产业生产扩张所造成的。张晓平(2009)计算了2000-2006年中国本土出口到美国消费的CO2排放量,显示美国和欧盟通过国际贸易净转移到中国的CO2排放量分别达到中国CO2 总排放的4.1%~5.1%和1.8%~4.0%。Zhao等(2016)分析了1995-2009年中国与美国双边贸易的隐含碳排放驱动机制,认为海外贸易需求是中国对美国的隐含碳排放快速增加的最主要驱动因素。Liu 等(2016)对中国国际碳转移量的量化研究也表明,2007年,中国由于生产供发达国家消费商品所产生的国际碳排放转移高达17亿t CO2,占自身工业排放总量的1/4;2013年,中国由于国际贸易而被转移的隐含碳排放总量大于日本或德国的全年碳排放总量,相当于全球排放量第5位。
这些研究成果揭示了国际贸易中隐含的碳排放空间转移对中国造成的实际影响,说明了中国作为全球最大碳排放国家并非完全为了自身发展而排放了全部的碳,而是同时承担了很大比重的其他国家发展所需的碳排放(Pan et al, 2008; Guo et al, 2012)。这对理清中国碳排放账户,在国际碳减排博弈中争取自身应得利益起到了非常重要的作用,同时也为避免区域间碳泄漏,真正意义上减少全球碳排放总量提供了科学的依据。
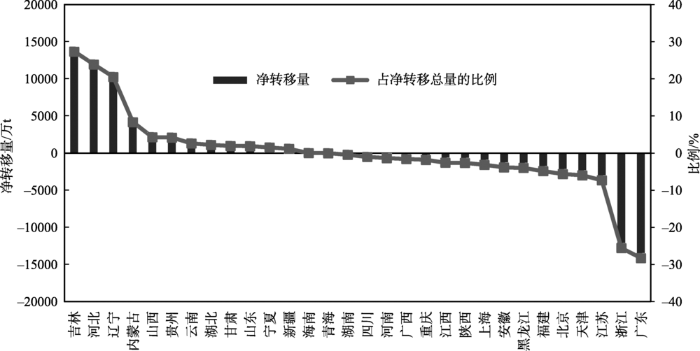
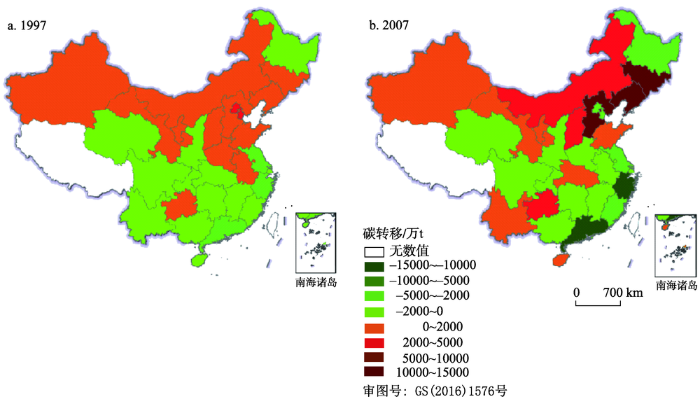
随着研究广泛开展,越来越多的学者意识到,在重视国际贸易的同时,还应该同样高度重视碳排放空间转移问题在另一个重要领域的重大研究价值,那就是一国之内各区域间贸易隐含的碳排放空间转移问题。中国有34个省级行政区,包括23个省、5个自治区、4个直辖市、2个特别行政区。省际之间贸易壁垒较小,省际贸易复杂、频繁且规模巨大,因此,对于中国而言,省际要素流动和经济联系对区域碳排放量的实际影响更加重要(Afton et al, 2011; Liu et al, 2015b; Cheng et al, 2018)。研究省际贸易的碳排放转移问题,对于深入揭示中国碳排放形成原因,促进形成区际协同作用,高效发挥碳减排投入总体功效、科学合理地切实减少自身碳排放具有重要的理论和现实意义。
省际贸易的碳排放转移问题的核心研究价值体现在其对具体国家或区域的自身碳排放量变化和碳减排效果方面具有的重要影响。因为排除国际贸易的干扰,省际贸易结构和产品供需关系,是造成某国自身碳排放产生和内部跨区域迁移的重要原因,省际碳排放空间转移对一国的碳排放总量变化、碳排放空间格局以及内部各区域协调发展的影响更为重要。特别是对于地域面积广阔,省际贸易总量大、结构复杂的国家而言尤其如此,而这些大国也往往都是世界碳排放量排名居前、对全球碳排放格局影响重大的国家,如中国、美国、日本、印度、巴西等。国内各行政区之间贸易隐含碳转移的影响对这些国家而言甚至超过了国际贸易对其产生的影响(Druckman, 2009; 石敏俊等, 2012; 王向阳等, 2016)。所以,针对省际贸易碳排放空间转移问题的研究,在切实减少一国国内碳排放方面,具有更重要的现实意义和研究价值(Guo et al, 2012),近年来逐渐引起了国内外学者的重视,也必将是未来该领域学术界研究的重要方向和热点之一。
国内外学者对区间贸易隐含碳排放转移问题研究成果的大量出现,近年来引发了全球对区域间碳减排合作方式的全新思考(Chen et al, 2016)。传统的固定区域碳排放削减措施由于没有充分考虑区域间的碳排放转移问题,导致一些地区为了减少碳排放,而从其他区域进口高碳排放的产品,这样的碳减排政策所产生的碳减排效果往往不能充分发挥作用,甚至可能造成局部减排,但总量反而增加,或者一个区域减排、多个区域增加的情况(Munksgaard, 2001; Zhong et al, 2018)。因为在这种情形下,理论上如果一个国家完全通过进口国外制造的商品来代替国内生产,就会出现零碳排放的情况,而实际上对全球碳排放总量没有丝毫减少,甚至由于生产国技术水平差异,会造成全球碳排放总量的增加。也就是学术界所指出的区域间“碳泄漏”问题(Rhee et al, 2006; Liu et al, 2015a)。
基于这种认识,大量学者提出了应根据区域贸易关系特征,提出更科学的产业结构调整策略,制定更为合理的碳减排政策(Ferng, 2003; Peters et al, 2007; Peters, 2008; 钟章奇等, 2017; 余晓泓等, 2018)。这些学者主张在碳减排的调控对策中,应充分考虑区域碳排放转移量,综合考虑不同地区的相对技术差异、贸易需求、贸易结构、贸易规模等影响因素,科学分析各类影响因素的影响机理和作用程度,科学制定碳减排调控对策(Peters et al, 2008b; Zhang Y X et al, 2014; Yang et al, 2017)。但是,目前对隐含碳排放转移研究成果的应用还基本停留在宏观层面的权责协调领域。由于缺乏碳转移动态驱动机制的探索,无法深入剖析长期遭受“碳泄漏”的持续性、变化性、系统性复杂原因,更无法针对碳转移机制制定有效的产业调控方案,难以真正破解“碳泄漏”困境。然而,深入产业部门层面的碳转移调控对策研究,对产业结构转型升级的方向和具体方案制定给予实际的指导,却是此类研究成果最能体现价值的用武之地。
同时,越来越多的学者认识到,在区际碳减排权责划分原则方面,单纯的生产者负责体系和单纯的消费者负责体系,都难以保证减排效果的最优(Gallego et al, 2005; Zhang Z K et al, 2014),只有充分研究区域贸易双方的价值转移和碳排放转移协同关系,制定针对贸易双方的协同调控措施,才能再保证区际贸易的经济效益的同时,最大限度的减少碳排放转移(Lenzen et al, 2007; Baker, 2018)。这也将是未来碳排放空间转移研究需要解决的重要问题之一,对于指导区域碳减排和区际碳减排权责协调机制等实际问题,具有重要价值。
Evolution characteristics and structural decomposition of regional carbon emission transfer and implications for carbon-reduction policy: Taking Henan Province as an example
[J]. Scientia Geographica Sinica, 37(5): 773-782.]
The so-called post-China countries (PC-1607s), distinguished by low wages and high economic growth, will replace China as the “world’s factory”. The aim of this paper is to assess the effect of these changes on global CO2emissions pathways. To achieve this, a counterfactual is proposed wherein China’s trade with the rest of the world is replaced by the PC-16’s trade in a global multiregional input–output context. The emissions savings realized by trade replacement are significant in those scenarios where the current pattern of trade is maintained (6113% on emissions traded and 613.5% on global emissions) and in scenarios where enterprises relocate their production directly or indirectly to the most environmentally efficient countries (ranging from 6115.2% to 6118.2% on emissions embodied in trade). Nevertheless, the potential savings drop considerably (ranging from 611.5% to 617.1%) if companies and host countries take advantage of cheaper, but more polluting means of production and do not internalize the externalities. Through changes in international trade, there is a possibility of reducing emissions, which have to be included in international, multilateral and bilateral agreements to mitigate climate change if we do not want to lose the opportunities these changes present.
[23]
BakerL.2018.
Of embodied emissions and inequality: Rethinking energy consumption
Multi-regional input-output analysis of spatial-temporal evolution driving force for carbon emissions embodied in interprovincial trade and optimization polices: A case study of northeast industrial district in China
By using the latest China–Japan input–output data sets and the index decomposition analysis (IDA) approach, this article analyzes the driving forces of CO 2 emissions embodied in trade between the two countries during 1990–2000. We found that the growth of trade volume had a large influence on the increase of CO 2 emissions embodiments in bilateral trade. The dramatic decline in carbon intensity of the Chinese economy is a primary cause in offsetting CO 2 emissions exported from China to Japan over 1995–2000. We argue that a better understanding of the factors affecting CO 2 emissions embodied in international trade will assist in seeking more effective climate policies with wider participation in the post-Kyoto regime.
[30]
DruckmanA, JacksonT.2009.
The carbon footprint of UK households 1990-2004: A socio-economically disaggregated, quasi-multi-regional input-output model
China faces the challenge of balancing unprecedented economic growth and environmental sustainability. Rather than a homogenous country that can be analyzed at the national level, China is a vast country with significant regional differences in physical geography, regional economy, demographics, industry structure, and household consumption patterns. There are pronounced differences between the much-developed Eastern-Coastal economic zone and the less developed Central and Western economic zones in China. Such variations lead to large regional discrepancies in carbon dioxide (CO2) emissions. Using the 28 regional input-output tables of China for 2002 and 2007 and structural decomposition analysis (SDA), we analyze how changes in population, technology, economic structure, urbanization, and household consumption patterns drive regional CO2 emissions.The results show a significant gap between the three economic zones in terms of CO2 emission intensity, as the Eastern-Coastal zone possesses more advanced production technologies compared to the Central and Western zones. The most polluting sectors and largest companies are state-owned enterprises and thus are potentially able to speed up knowledge transfer between companies and regions. The 090008greening090009 of the more developed areas is not only a result of superior technology, but also of externalizing production and pollution to the poorer regions in China. The results also show that urbanization and associated income and lifestyle changes were important driving forces for the growth of CO2 emissions in most regions in China. Therefore, focusing on technology and efficiency alone is not sufficient to curb regional CO2 emissions.
[32]
Ferng JJ.2003.
Allocating the responsibility of CO2 over-emissions from the perspectives of benefit principle and ecological deficit
IPCC. 2007. Climate change 2007: The physical science basis: Contribution of working group I to the fourth assessment report of the Intergovernmental Panel on Climate Change[M]. Cambridge, UK: Cambridge University Press.
61An IO model is used to measure carbon emissions embodied in demand–supply chains.61Embodied emissions in products for final consumption and export are distinguished.61The net transfer of emissions caused by final use increased rapidly in China.
[41]
Liu HG, Liu WD, Fan XM, et al.2015b.
Carbon emissions embodied in value added chains in China
International negotiations of reducing CO 2 emissions address the question of how to account annual CO 2 emissions. For open economies like Denmark facing national CO 2 targets import and export of commodities influence the total accounted CO 2 emissions. In this article we demonstrate the consequences of using two basic accounting principles: a production versus a consumption principle. The distinction between the two principles is whether the producer or the consumer is responsible for the CO 2 emitted. By subtracting total emissions based on the two accounting principles we develop the concept of a “CO 2 trade balance”. Using Denmark as a case, we show that from 1989 to 1994 the CO 2 trade balance has changed dramatically turning into a deficit of 7 million tonnes from a surplus of 0.5 million tonnes in 1987. Consequently, it has become more difficult to reach the national CO 2 target as an increasing part of emissions from Danish territory is caused by foreign demand.
[47]
MunozP, Steininger KW.2010.
Austria's CO2 responsibility and the carbon content of its international trade
Seeking to limit global warming to 2 C puts narrow restrictions on the remaining carbon budget. While the prevalent accounting framework for carbon emissions is production based (Production-Based Principle, PBP), we here quantify the CO 2 emissions on the basis of the Consumption-Based Principle (CBP) for Austria. At a methodological level, a Multi-Regional Input utput model with full linkages is used to account for Austria's CO 2 responsibility on a global scale. Estimates are carried out for the years 1997 and 2004. Results show that during 1997 CO 2 responsibility based on CBP were 36% larger than those based on PBP. This relation has increased through time. The CBP indicator of 2004 was 44% larger than the PBP. In terms of carbon emission location, for each Euro spent on Austrian final demand in 2004, it is estimated that two-thirds of the CO 2 emissions occur outside Austrian borders. Regarding the origin of the emissions embodied in imports, it is estimated that about one-fourth originated in non-Annex I countries in 1997. This proportion increased to one-third by 2004. Due to this divergence between CBP and PBP indicators, there is a need to re-think current accounting bases in order to properly assign CO 2 responsibilities.
[48]
Pan JH,PhillipsJ,ChenY.2008.
China's balance of emissions embodied in trade: Approaches to measurement and allocating international responsibility
[J]. Oxford Review of Economic Policy, 24(2): 354-376.
Energy-related CO 2 emissions embodied in international trade have been widely studied by researchers using the input–output analysis framework. These studies are often conducted at a specific level of sector aggregation and the choice made to a large extent is dictated by economic and energy data availability. We investigate analytically the possible effects of sector aggregation on the study results. We conduct empirical studies using the data of China and Singapore where energy-related CO 2 emissions embodied in their exports are estimated at different levels of sector aggregation. A finding from the studies is that levels around 40 sectors appear to be sufficient to capture the overall share of emissions embodied in a country's exports. Another finding is that in approximating the “ideal” situation the hybrid data treatment approach produces better results than the uniformly distributed data treatment approach. Other findings and some recommendations are also presented.
[61]
SuB, Ang BW.2011.
Multi-region input-output analysis of CO2 emissions embodied in trade: The feedback effects
The Ecological Footprint as an indicator that accounts for human demand on global bioproductivity sets out to quantify the impacts associated with consumption in a given country, including the impacts associated with trade. The National Footprint Accounts (NFA) by Global Footprint Network (GFN) calculate trade-embodied Footprints by multiplying yield and embodied energy factors with mass volumes of traded goods in a “Product Land Use Matrix (PLUM)”. This article compares energy Footprints embodied in trade from and to the United Kingdom in 2002 as calculated by the NFA-PLUM with the results from a recently developed multi-region input–output model (MRIO) for the UK. Although totals for imports and exports are comparable, breaking down the results by economic sectors reveals large differences and hardly any correlation between the two methods. The omission of trade in services (especially transport services) and upstream impacts of energy goods (fossil fuels) and the use of inappropriate embodied energy factors in the NFA-PLUM method are identified as the main reasons for these differences. In the light of the results it seems that a comprehensive Footprint account of trade can better be achieved with an input–output based approach. I conclude that MRIO models – once fully developed – will be particularly suitable in the future to estimate the Ecological Footprints of imports and exports of nations with the possibility to track their origin via inter-industry linkages, international supply chains and multi-national trade flows.
[68]
WiedmannT.2009b.
A review of recent multi-region input-output models used for consumption-based emission and resource accounting
China’s CO2 emissions have sharply increased in recent years with soaring economic development and urbanization. Consumption-based accounting of CO2 emissions could provide new insights for allocating regional mitigation responsibility and curbing the emissions. A multi-regional input–output model is used to study the trends and disparities of consumption-based emissions from Chinese provinces during the period 2002–2007. Results show that China’s consumption-based CO2 emissions grew from 3549Mt in 2002 to 5403Mt in 2007 with an annual average growth rate of 8.8%. The annual growth rate in the richer eastern region was over 10% because of a rapid increase in capital investment and the growth of urban consumption. Consumption-based CO2 emissions embodied in interprovincial trades contributed only 10% (351Mt) to the national total of such emissions in 2002, but 16% (864Mt) in 2007. Given low per capita emissions currently, China’s consumption-based emissions have much room to grow because of further development of urbanization and stimulation of domestic demand. The government should pay greater attention to controlling CO2 emissions from a consumption-based perspective.
[78]
Zhu YB, Shi YJ, WuJ, et al.2018.
Exploring the characteristics of CO2 emissions embodied in international trade and the fair share of responsibility
Embodied carbon in China's foreign trade: An online SCI-E and SSCI based literature review
1
2017
... 中国是全球最大的碳排放国,也是国际贸易大国,近年来国内外学者针对中国及其各省区对外进出口贸易隐含的碳排放空间转移研究日渐增多(Andersson, 2018).对Web of Science的搜索发现,1981-2017年,关于中国国际贸易隐含碳排放的相关研究达到317篇,占国际贸易隐含碳排放研究的85%,并从2010年开始呈现快速增长的态势,2017年相关的研究论文高达116篇(Zhang et al, 2017).而针对中国国际贸易隐含碳转移的研究成果再次说明,中国是承受全球碳泄漏最为严重的国家之一,区际贸易隐含碳转移,也是造成中国成为全球碳排放第一大国的关键原因之一(齐晔等, 2008; 潘安, 2017).如,Shui等(2006)通过研究中美之间国际贸易造成的碳排放空间迁移变化发现,1997-2003年7%~14%的中国CO2排放是由于美国消费需求扩大而引起中国相关产业生产扩张所造成的.张晓平(2009)计算了2000-2006年中国本土出口到美国消费的CO2排放量,显示美国和欧盟通过国际贸易净转移到中国的CO2排放量分别达到中国CO2 总排放的4.1%~5.1%和1.8%~4.0%.Zhao等(2016)分析了1995-2009年中国与美国双边贸易的隐含碳排放驱动机制,认为海外贸易需求是中国对美国的隐含碳排放快速增加的最主要驱动因素.Liu 等(2016)对中国国际碳转移量的量化研究也表明,2007年,中国由于生产供发达国家消费商品所产生的国际碳排放转移高达17亿t CO2,占自身工业排放总量的1/4;2013年,中国由于国际贸易而被转移的隐含碳排放总量大于日本或德国的全年碳排放总量,相当于全球排放量第5位. ...
The effects of direct trade within China on regional and national CO2 emissions
0
2014
Driving factors of carbon emissions embodied in China—US trade: A structural decomposition analysis
1
2016
... 中国是全球最大的碳排放国,也是国际贸易大国,近年来国内外学者针对中国及其各省区对外进出口贸易隐含的碳排放空间转移研究日渐增多(Andersson, 2018).对Web of Science的搜索发现,1981-2017年,关于中国国际贸易隐含碳排放的相关研究达到317篇,占国际贸易隐含碳排放研究的85%,并从2010年开始呈现快速增长的态势,2017年相关的研究论文高达116篇(Zhang et al, 2017).而针对中国国际贸易隐含碳转移的研究成果再次说明,中国是承受全球碳泄漏最为严重的国家之一,区际贸易隐含碳转移,也是造成中国成为全球碳排放第一大国的关键原因之一(齐晔等, 2008; 潘安, 2017).如,Shui等(2006)通过研究中美之间国际贸易造成的碳排放空间迁移变化发现,1997-2003年7%~14%的中国CO2排放是由于美国消费需求扩大而引起中国相关产业生产扩张所造成的.张晓平(2009)计算了2000-2006年中国本土出口到美国消费的CO2排放量,显示美国和欧盟通过国际贸易净转移到中国的CO2排放量分别达到中国CO2 总排放的4.1%~5.1%和1.8%~4.0%.Zhao等(2016)分析了1995-2009年中国与美国双边贸易的隐含碳排放驱动机制,认为海外贸易需求是中国对美国的隐含碳排放快速增加的最主要驱动因素.Liu 等(2016)对中国国际碳转移量的量化研究也表明,2007年,中国由于生产供发达国家消费商品所产生的国际碳排放转移高达17亿t CO2,占自身工业排放总量的1/4;2013年,中国由于国际贸易而被转移的隐含碳排放总量大于日本或德国的全年碳排放总量,相当于全球排放量第5位. ...
Transnational transfer of carbon emissions embodied in trade: Characteristics and determinants from a spatial perspective
1
2018
... 国内外学者对区间贸易隐含碳排放转移问题研究成果的大量出现,近年来引发了全球对区域间碳减排合作方式的全新思考(Chen et al, 2016).传统的固定区域碳排放削减措施由于没有充分考虑区域间的碳排放转移问题,导致一些地区为了减少碳排放,而从其他区域进口高碳排放的产品,这样的碳减排政策所产生的碳减排效果往往不能充分发挥作用,甚至可能造成局部减排,但总量反而增加,或者一个区域减排、多个区域增加的情况(Munksgaard, 2001; Zhong et al, 2018).因为在这种情形下,理论上如果一个国家完全通过进口国外制造的商品来代替国内生产,就会出现零碳排放的情况,而实际上对全球碳排放总量没有丝毫减少,甚至由于生产国技术水平差异,会造成全球碳排放总量的增加.也就是学术界所指出的区域间“碳泄漏”问题(Rhee et al, 2006; Liu et al, 2015a). ...
基于EA-SD模型的生态农业系统模拟与优化调控: 以平凉市崆峒区为例
1
2012
... 近年来,温室气体排放引起的全球气候变化,已日渐威胁到全球生态平衡和人类社会的可持续发展(Peters et al, 2011; Dong et al, 2017).控制CO2等温室气体的排放,已成为当前人类应对全球气候变化的重要任务(李富佳等, 2012; Li et al, 2017).目前,核算区域碳排放的方法一般采用《联合国气候变化框架公约》中提出的生产责任法,即因生产、出口和调出产品而排放的CO2包含在一个区域的碳排放账户里,但因进口和调入引起的碳排放却被排除在外.然而,随着区域间贸易,经济发达地区会通过区际贸易从经济落后地区调入高碳排放的产品,从而使经济发达地区表面上实现了碳减排,实际上却是以经济落后地区碳排放量增长为代价.而落后地区为了经济发展,必须长时间生产此类产品.发达地区虽然减排成效显著,但却加重了欠发达地区的碳减排压力.这种严重的双边贸易过程中隐含的碳转移问题既存在于国家之间,也广泛存在于经济体系相对独立的不同行政单元之间.区际碳排放转移直接导致了区域间在整体上不但没有实现碳减排,反而加剧了彼此碳减排权责的不公平、低效率和高成本.区际碳隐含转移问题对区域碳排放格局和碳减排效果影响重大,是造成区域间减排压力转嫁、整体减排效果抵消、碳排放净转出区经济增长负担加重和产业结构升级转型困难等问题的重要原因之一(Miller et al, 2009; 李富佳等, 2015). ...
基于SD模型的循环农业系统构建及其综合效益评价研究
1
2015
... 近年来,温室气体排放引起的全球气候变化,已日渐威胁到全球生态平衡和人类社会的可持续发展(Peters et al, 2011; Dong et al, 2017).控制CO2等温室气体的排放,已成为当前人类应对全球气候变化的重要任务(李富佳等, 2012; Li et al, 2017).目前,核算区域碳排放的方法一般采用《联合国气候变化框架公约》中提出的生产责任法,即因生产、出口和调出产品而排放的CO2包含在一个区域的碳排放账户里,但因进口和调入引起的碳排放却被排除在外.然而,随着区域间贸易,经济发达地区会通过区际贸易从经济落后地区调入高碳排放的产品,从而使经济发达地区表面上实现了碳减排,实际上却是以经济落后地区碳排放量增长为代价.而落后地区为了经济发展,必须长时间生产此类产品.发达地区虽然减排成效显著,但却加重了欠发达地区的碳减排压力.这种严重的双边贸易过程中隐含的碳转移问题既存在于国家之间,也广泛存在于经济体系相对独立的不同行政单元之间.区际碳排放转移直接导致了区域间在整体上不但没有实现碳减排,反而加剧了彼此碳减排权责的不公平、低效率和高成本.区际碳隐含转移问题对区域碳排放格局和碳减排效果影响重大,是造成区域间减排压力转嫁、整体减排效果抵消、碳排放净转出区经济增长负担加重和产业结构升级转型困难等问题的重要原因之一(Miller et al, 2009; 李富佳等, 2015). ...
... 基于这种认识,大量学者提出了应根据区域贸易关系特征,提出更科学的产业结构调整策略,制定更为合理的碳减排政策(Ferng, 2003; Peters et al, 2007; Peters, 2008; 钟章奇等, 2017; 余晓泓等, 2018).这些学者主张在碳减排的调控对策中,应充分考虑区域碳排放转移量,综合考虑不同地区的相对技术差异、贸易需求、贸易结构、贸易规模等影响因素,科学分析各类影响因素的影响机理和作用程度,科学制定碳减排调控对策(Peters et al, 2008b; Zhang Y X et al, 2014; Yang et al, 2017).但是,目前对隐含碳排放转移研究成果的应用还基本停留在宏观层面的权责协调领域.由于缺乏碳转移动态驱动机制的探索,无法深入剖析长期遭受“碳泄漏”的持续性、变化性、系统性复杂原因,更无法针对碳转移机制制定有效的产业调控方案,难以真正破解“碳泄漏”困境.然而,深入产业部门层面的碳转移调控对策研究,对产业结构转型升级的方向和具体方案制定给予实际的指导,却是此类研究成果最能体现价值的用武之地. ...
基于收益原则的碳排放转移及中国碳排放责任研究
1
2018
... 基于这种认识,大量学者提出了应根据区域贸易关系特征,提出更科学的产业结构调整策略,制定更为合理的碳减排政策(Ferng, 2003; Peters et al, 2007; Peters, 2008; 钟章奇等, 2017; 余晓泓等, 2018).这些学者主张在碳减排的调控对策中,应充分考虑区域碳排放转移量,综合考虑不同地区的相对技术差异、贸易需求、贸易结构、贸易规模等影响因素,科学分析各类影响因素的影响机理和作用程度,科学制定碳减排调控对策(Peters et al, 2008b; Zhang Y X et al, 2014; Yang et al, 2017).但是,目前对隐含碳排放转移研究成果的应用还基本停留在宏观层面的权责协调领域.由于缺乏碳转移动态驱动机制的探索,无法深入剖析长期遭受“碳泄漏”的持续性、变化性、系统性复杂原因,更无法针对碳转移机制制定有效的产业调控方案,难以真正破解“碳泄漏”困境.然而,深入产业部门层面的碳转移调控对策研究,对产业结构转型升级的方向和具体方案制定给予实际的指导,却是此类研究成果最能体现价值的用武之地. ...
... 中国是全球最大的碳排放国,也是国际贸易大国,近年来国内外学者针对中国及其各省区对外进出口贸易隐含的碳排放空间转移研究日渐增多(Andersson, 2018).对Web of Science的搜索发现,1981-2017年,关于中国国际贸易隐含碳排放的相关研究达到317篇,占国际贸易隐含碳排放研究的85%,并从2010年开始呈现快速增长的态势,2017年相关的研究论文高达116篇(Zhang et al, 2017).而针对中国国际贸易隐含碳转移的研究成果再次说明,中国是承受全球碳泄漏最为严重的国家之一,区际贸易隐含碳转移,也是造成中国成为全球碳排放第一大国的关键原因之一(齐晔等, 2008; 潘安, 2017).如,Shui等(2006)通过研究中美之间国际贸易造成的碳排放空间迁移变化发现,1997-2003年7%~14%的中国CO2排放是由于美国消费需求扩大而引起中国相关产业生产扩张所造成的.张晓平(2009)计算了2000-2006年中国本土出口到美国消费的CO2排放量,显示美国和欧盟通过国际贸易净转移到中国的CO2排放量分别达到中国CO2 总排放的4.1%~5.1%和1.8%~4.0%.Zhao等(2016)分析了1995-2009年中国与美国双边贸易的隐含碳排放驱动机制,认为海外贸易需求是中国对美国的隐含碳排放快速增加的最主要驱动因素.Liu 等(2016)对中国国际碳转移量的量化研究也表明,2007年,中国由于生产供发达国家消费商品所产生的国际碳排放转移高达17亿t CO2,占自身工业排放总量的1/4;2013年,中国由于国际贸易而被转移的隐含碳排放总量大于日本或德国的全年碳排放总量,相当于全球排放量第5位. ...
中国对外贸易产生的CO2排放区位转移效应分析
1
2009
... 中国是全球最大的碳排放国,也是国际贸易大国,近年来国内外学者针对中国及其各省区对外进出口贸易隐含的碳排放空间转移研究日渐增多(Andersson, 2018).对Web of Science的搜索发现,1981-2017年,关于中国国际贸易隐含碳排放的相关研究达到317篇,占国际贸易隐含碳排放研究的85%,并从2010年开始呈现快速增长的态势,2017年相关的研究论文高达116篇(Zhang et al, 2017).而针对中国国际贸易隐含碳转移的研究成果再次说明,中国是承受全球碳泄漏最为严重的国家之一,区际贸易隐含碳转移,也是造成中国成为全球碳排放第一大国的关键原因之一(齐晔等, 2008; 潘安, 2017).如,Shui等(2006)通过研究中美之间国际贸易造成的碳排放空间迁移变化发现,1997-2003年7%~14%的中国CO2排放是由于美国消费需求扩大而引起中国相关产业生产扩张所造成的.张晓平(2009)计算了2000-2006年中国本土出口到美国消费的CO2排放量,显示美国和欧盟通过国际贸易净转移到中国的CO2排放量分别达到中国CO2 总排放的4.1%~5.1%和1.8%~4.0%.Zhao等(2016)分析了1995-2009年中国与美国双边贸易的隐含碳排放驱动机制,认为海外贸易需求是中国对美国的隐含碳排放快速增加的最主要驱动因素.Liu 等(2016)对中国国际碳转移量的量化研究也表明,2007年,中国由于生产供发达国家消费商品所产生的国际碳排放转移高达17亿t CO2,占自身工业排放总量的1/4;2013年,中国由于国际贸易而被转移的隐含碳排放总量大于日本或德国的全年碳排放总量,相当于全球排放量第5位. ...
区域碳排放转移的演变特征与结构分解及减排对策分析: 以河南省为例
1
2017
... 基于这种认识,大量学者提出了应根据区域贸易关系特征,提出更科学的产业结构调整策略,制定更为合理的碳减排政策(Ferng, 2003; Peters et al, 2007; Peters, 2008; 钟章奇等, 2017; 余晓泓等, 2018).这些学者主张在碳减排的调控对策中,应充分考虑区域碳排放转移量,综合考虑不同地区的相对技术差异、贸易需求、贸易结构、贸易规模等影响因素,科学分析各类影响因素的影响机理和作用程度,科学制定碳减排调控对策(Peters et al, 2008b; Zhang Y X et al, 2014; Yang et al, 2017).但是,目前对隐含碳排放转移研究成果的应用还基本停留在宏观层面的权责协调领域.由于缺乏碳转移动态驱动机制的探索,无法深入剖析长期遭受“碳泄漏”的持续性、变化性、系统性复杂原因,更无法针对碳转移机制制定有效的产业调控方案,难以真正破解“碳泄漏”困境.然而,深入产业部门层面的碳转移调控对策研究,对产业结构转型升级的方向和具体方案制定给予实际的指导,却是此类研究成果最能体现价值的用武之地. ...
Carbon inequality at the sub-national scale: A case study of provincial-level inequality in CO2 emissions in China 1997-2007
1
2011
... 随着研究广泛开展,越来越多的学者意识到,在重视国际贸易的同时,还应该同样高度重视碳排放空间转移问题在另一个重要领域的重大研究价值,那就是一国之内各区域间贸易隐含的碳排放空间转移问题.中国有34个省级行政区,包括23个省、5个自治区、4个直辖市、2个特别行政区.省际之间贸易壁垒较小,省际贸易复杂、频繁且规模巨大,因此,对于中国而言,省际要素流动和经济联系对区域碳排放量的实际影响更加重要(Afton et al, 2011; Liu et al, 2015b; Cheng et al, 2018).研究省际贸易的碳排放转移问题,对于深入揭示中国碳排放形成原因,促进形成区际协同作用,高效发挥碳减排投入总体功效、科学合理地切实减少自身碳排放具有重要的理论和现实意义. ...
International trade and carbon emissions: The role of Chinese institutional and policy reforms
1
2018
... 中国是全球最大的碳排放国,也是国际贸易大国,近年来国内外学者针对中国及其各省区对外进出口贸易隐含的碳排放空间转移研究日渐增多(Andersson, 2018).对Web of Science的搜索发现,1981-2017年,关于中国国际贸易隐含碳排放的相关研究达到317篇,占国际贸易隐含碳排放研究的85%,并从2010年开始呈现快速增长的态势,2017年相关的研究论文高达116篇(Zhang et al, 2017).而针对中国国际贸易隐含碳转移的研究成果再次说明,中国是承受全球碳泄漏最为严重的国家之一,区际贸易隐含碳转移,也是造成中国成为全球碳排放第一大国的关键原因之一(齐晔等, 2008; 潘安, 2017).如,Shui等(2006)通过研究中美之间国际贸易造成的碳排放空间迁移变化发现,1997-2003年7%~14%的中国CO2排放是由于美国消费需求扩大而引起中国相关产业生产扩张所造成的.张晓平(2009)计算了2000-2006年中国本土出口到美国消费的CO2排放量,显示美国和欧盟通过国际贸易净转移到中国的CO2排放量分别达到中国CO2 总排放的4.1%~5.1%和1.8%~4.0%.Zhao等(2016)分析了1995-2009年中国与美国双边贸易的隐含碳排放驱动机制,认为海外贸易需求是中国对美国的隐含碳排放快速增加的最主要驱动因素.Liu 等(2016)对中国国际碳转移量的量化研究也表明,2007年,中国由于生产供发达国家消费商品所产生的国际碳排放转移高达17亿t CO2,占自身工业排放总量的1/4;2013年,中国由于国际贸易而被转移的隐含碳排放总量大于日本或德国的全年碳排放总量,相当于全球排放量第5位. ...
Carbon emissions embodied in international trade: The post-China
Of embodied emissions and inequality: Rethinking energy consumption
1
2018
... 同时,越来越多的学者认识到,在区际碳减排权责划分原则方面,单纯的生产者负责体系和单纯的消费者负责体系,都难以保证减排效果的最优(Gallego et al, 2005; Zhang Z K et al, 2014),只有充分研究区域贸易双方的价值转移和碳排放转移协同关系,制定针对贸易双方的协同调控措施,才能再保证区际贸易的经济效益的同时,最大限度的减少碳排放转移(Lenzen et al, 2007; Baker, 2018).这也将是未来碳排放空间转移研究需要解决的重要问题之一,对于指导区域碳减排和区际碳减排权责协调机制等实际问题,具有重要价值. ...
Allocation and leakage in regional cap-and-trade markets for CO2
1
2012
... 在微观方面,也有大量学者以单一的国家或地区为案例,对碳排放跨区域转移量进行核算.其结论均证明了区域间贸易引起的碳排放迁移量,在区域碳排放总量中往往占据着不可忽视的比重,对单个国家和地区的碳排放总量和构成具有显著影响(Munoz et al, 2010; Bushnell et al, 2012; Cahill et al, 2012).如Schaeffer等(1996)对巴西 1970-1993 年非能源商品进出口中隐含的碳排放量进行了评估,证明巴西1980年以来一直保持着较高的净出口隐含碳排放量,而1990 年这部分碳排放量已占到巴西总碳排放量的11.4%.而Sánchez-Chóliz等(2004)对西班牙的研究也同样表明,西班牙在进口和出口贸易中隐含的碳排放量分别占到了总排放量的36%和37%.同样,Ståhls等(2011)对芬兰1991-2005年的国际贸易分析也显示,芬兰几乎所有的碳排放都是由于出口产品造成的.也就是说,碳排放净出口国在出口贸易过程中,承担了其他国家消费的碳排放;而碳排放净进口国家则在进口贸易中将自身所应承担的部分碳排放量转移到了其产品供应国. ...
Combining physical and economic output data to analyse energy and CO2 emissions trends in industry
1
2012
... 在微观方面,也有大量学者以单一的国家或地区为案例,对碳排放跨区域转移量进行核算.其结论均证明了区域间贸易引起的碳排放迁移量,在区域碳排放总量中往往占据着不可忽视的比重,对单个国家和地区的碳排放总量和构成具有显著影响(Munoz et al, 2010; Bushnell et al, 2012; Cahill et al, 2012).如Schaeffer等(1996)对巴西 1970-1993 年非能源商品进出口中隐含的碳排放量进行了评估,证明巴西1980年以来一直保持着较高的净出口隐含碳排放量,而1990 年这部分碳排放量已占到巴西总碳排放量的11.4%.而Sánchez-Chóliz等(2004)对西班牙的研究也同样表明,西班牙在进口和出口贸易中隐含的碳排放量分别占到了总排放量的36%和37%.同样,Ståhls等(2011)对芬兰1991-2005年的国际贸易分析也显示,芬兰几乎所有的碳排放都是由于出口产品造成的.也就是说,碳排放净出口国在出口贸易过程中,承担了其他国家消费的碳排放;而碳排放净进口国家则在进口贸易中将自身所应承担的部分碳排放量转移到了其产品供应国. ...
Tracking inter-regional carbon flows: A hybrid network model
1
2016
... 国内外学者对区间贸易隐含碳排放转移问题研究成果的大量出现,近年来引发了全球对区域间碳减排合作方式的全新思考(Chen et al, 2016).传统的固定区域碳排放削减措施由于没有充分考虑区域间的碳排放转移问题,导致一些地区为了减少碳排放,而从其他区域进口高碳排放的产品,这样的碳减排政策所产生的碳减排效果往往不能充分发挥作用,甚至可能造成局部减排,但总量反而增加,或者一个区域减排、多个区域增加的情况(Munksgaard, 2001; Zhong et al, 2018).因为在这种情形下,理论上如果一个国家完全通过进口国外制造的商品来代替国内生产,就会出现零碳排放的情况,而实际上对全球碳排放总量没有丝毫减少,甚至由于生产国技术水平差异,会造成全球碳排放总量的增加.也就是学术界所指出的区域间“碳泄漏”问题(Rhee et al, 2006; Liu et al, 2015a). ...
Multi-regional input-output analysis of spatial-temporal evolution driving force for carbon emissions embodied in interprovincial trade and optimization polices: A case study of northeast industrial district in China
1
2018
... 随着研究广泛开展,越来越多的学者意识到,在重视国际贸易的同时,还应该同样高度重视碳排放空间转移问题在另一个重要领域的重大研究价值,那就是一国之内各区域间贸易隐含的碳排放空间转移问题.中国有34个省级行政区,包括23个省、5个自治区、4个直辖市、2个特别行政区.省际之间贸易壁垒较小,省际贸易复杂、频繁且规模巨大,因此,对于中国而言,省际要素流动和经济联系对区域碳排放量的实际影响更加重要(Afton et al, 2011; Liu et al, 2015b; Cheng et al, 2018).研究省际贸易的碳排放转移问题,对于深入揭示中国碳排放形成原因,促进形成区际协同作用,高效发挥碳减排投入总体功效、科学合理地切实减少自身碳排放具有重要的理论和现实意义. ...
Assessment of comprehensive effects and optimization of a circular economy system of coal power and cement in Kongtong District
1
2017
... 近年来,温室气体排放引起的全球气候变化,已日渐威胁到全球生态平衡和人类社会的可持续发展(Peters et al, 2011; Dong et al, 2017).控制CO2等温室气体的排放,已成为当前人类应对全球气候变化的重要任务(李富佳等, 2012; Li et al, 2017).目前,核算区域碳排放的方法一般采用《联合国气候变化框架公约》中提出的生产责任法,即因生产、出口和调出产品而排放的CO2包含在一个区域的碳排放账户里,但因进口和调入引起的碳排放却被排除在外.然而,随着区域间贸易,经济发达地区会通过区际贸易从经济落后地区调入高碳排放的产品,从而使经济发达地区表面上实现了碳减排,实际上却是以经济落后地区碳排放量增长为代价.而落后地区为了经济发展,必须长时间生产此类产品.发达地区虽然减排成效显著,但却加重了欠发达地区的碳减排压力.这种严重的双边贸易过程中隐含的碳转移问题既存在于国家之间,也广泛存在于经济体系相对独立的不同行政单元之间.区际碳排放转移直接导致了区域间在整体上不但没有实现碳减排,反而加剧了彼此碳减排权责的不公平、低效率和高成本.区际碳隐含转移问题对区域碳排放格局和碳减排效果影响重大,是造成区域间减排压力转嫁、整体减排效果抵消、碳排放净转出区经济增长负担加重和产业结构升级转型困难等问题的重要原因之一(Miller et al, 2009; 李富佳等, 2015). ...
An analysis of the driving forces of CO2 emissions embodied in Japan-China trade
Allocating the responsibility of CO2 over-emissions from the perspectives of benefit principle and ecological deficit
1
2003
... 基于这种认识,大量学者提出了应根据区域贸易关系特征,提出更科学的产业结构调整策略,制定更为合理的碳减排政策(Ferng, 2003; Peters et al, 2007; Peters, 2008; 钟章奇等, 2017; 余晓泓等, 2018).这些学者主张在碳减排的调控对策中,应充分考虑区域碳排放转移量,综合考虑不同地区的相对技术差异、贸易需求、贸易结构、贸易规模等影响因素,科学分析各类影响因素的影响机理和作用程度,科学制定碳减排调控对策(Peters et al, 2008b; Zhang Y X et al, 2014; Yang et al, 2017).但是,目前对隐含碳排放转移研究成果的应用还基本停留在宏观层面的权责协调领域.由于缺乏碳转移动态驱动机制的探索,无法深入剖析长期遭受“碳泄漏”的持续性、变化性、系统性复杂原因,更无法针对碳转移机制制定有效的产业调控方案,难以真正破解“碳泄漏”困境.然而,深入产业部门层面的碳转移调控对策研究,对产业结构转型升级的方向和具体方案制定给予实际的指导,却是此类研究成果最能体现价值的用武之地. ...
A consistent input-output formulation of shared consumer and producer responsibility
1
2005
... 同时,越来越多的学者认识到,在区际碳减排权责划分原则方面,单纯的生产者负责体系和单纯的消费者负责体系,都难以保证减排效果的最优(Gallego et al, 2005; Zhang Z K et al, 2014),只有充分研究区域贸易双方的价值转移和碳排放转移协同关系,制定针对贸易双方的协同调控措施,才能再保证区际贸易的经济效益的同时,最大限度的减少碳排放转移(Lenzen et al, 2007; Baker, 2018).这也将是未来碳排放空间转移研究需要解决的重要问题之一,对于指导区域碳减排和区际碳减排权责协调机制等实际问题,具有重要价值. ...
China's provincial CO2 emissions embodied in international and interprovincial trade
2
2012
... 这些研究成果揭示了国际贸易中隐含的碳排放空间转移对中国造成的实际影响,说明了中国作为全球最大碳排放国家并非完全为了自身发展而排放了全部的碳,而是同时承担了很大比重的其他国家发展所需的碳排放(Pan et al, 2008; Guo et al, 2012).这对理清中国碳排放账户,在国际碳减排博弈中争取自身应得利益起到了非常重要的作用,同时也为避免区域间碳泄漏,真正意义上减少全球碳排放总量提供了科学的依据. ...
Manufacturing energy use in eight OECD countries: Decomposing the impacts of changes in output, industry structure and energy intensity
1
1991
... 20世纪末期,大量学者在研究区域能源消耗和碳排放时发现,在经济全球化和国际贸易日趋密切的背景和趋势下,某产品消费国的消费需求变化往往会造成其所需产品生产国的能源消耗和碳排放量随之发生变化.虽然消费国自身的碳排放量很少,但其贸易引起的关联性能源消耗和碳排放量却可能很大(Williams et al,1987; Howarth et al, 1991; Peters et al, 2008b; 魏本勇等, 2009; Zhu et al, 2018).此后,越来越多的学者对贸易碳排放转移问题展开了大量研究.特别是近年来随着CO2 排放对全球变暖的影响引起全球的强烈关注(IPCC, 2006, 2007),全球碳减排合作不断加深、区域间在碳排放责任与减排目标等领域的博弈日趋激烈,贸易引发的碳排放空间转移问题开始逐渐成为学术界研究的一大热点(Wiedmann, 2009a, 2009b; Rüstemoğlu et al, 2016). ...
IPCC guidelines for national greenhouse gas inventories
1
2006
... 20世纪末期,大量学者在研究区域能源消耗和碳排放时发现,在经济全球化和国际贸易日趋密切的背景和趋势下,某产品消费国的消费需求变化往往会造成其所需产品生产国的能源消耗和碳排放量随之发生变化.虽然消费国自身的碳排放量很少,但其贸易引起的关联性能源消耗和碳排放量却可能很大(Williams et al,1987; Howarth et al, 1991; Peters et al, 2008b; 魏本勇等, 2009; Zhu et al, 2018).此后,越来越多的学者对贸易碳排放转移问题展开了大量研究.特别是近年来随着CO2 排放对全球变暖的影响引起全球的强烈关注(IPCC, 2006, 2007),全球碳减排合作不断加深、区域间在碳排放责任与减排目标等领域的博弈日趋激烈,贸易引发的碳排放空间转移问题开始逐渐成为学术界研究的一大热点(Wiedmann, 2009a, 2009b; Rüstemoğlu et al, 2016). ...
1
2007
... 20世纪末期,大量学者在研究区域能源消耗和碳排放时发现,在经济全球化和国际贸易日趋密切的背景和趋势下,某产品消费国的消费需求变化往往会造成其所需产品生产国的能源消耗和碳排放量随之发生变化.虽然消费国自身的碳排放量很少,但其贸易引起的关联性能源消耗和碳排放量却可能很大(Williams et al,1987; Howarth et al, 1991; Peters et al, 2008b; 魏本勇等, 2009; Zhu et al, 2018).此后,越来越多的学者对贸易碳排放转移问题展开了大量研究.特别是近年来随着CO2 排放对全球变暖的影响引起全球的强烈关注(IPCC, 2006, 2007),全球碳减排合作不断加深、区域间在碳排放责任与减排目标等领域的博弈日趋激烈,贸易引发的碳排放空间转移问题开始逐渐成为学术界研究的一大热点(Wiedmann, 2009a, 2009b; Rüstemoğlu et al, 2016). ...
Shared producer and consumer responsibility-theory and practice
1
2007
... 同时,越来越多的学者认识到,在区际碳减排权责划分原则方面,单纯的生产者负责体系和单纯的消费者负责体系,都难以保证减排效果的最优(Gallego et al, 2005; Zhang Z K et al, 2014),只有充分研究区域贸易双方的价值转移和碳排放转移协同关系,制定针对贸易双方的协同调控措施,才能再保证区际贸易的经济效益的同时,最大限度的减少碳排放转移(Lenzen et al, 2007; Baker, 2018).这也将是未来碳排放空间转移研究需要解决的重要问题之一,对于指导区域碳减排和区际碳减排权责协调机制等实际问题,具有重要价值. ...
Re-estimating CO2 emission factors for gasoline passenger cars adding driving behaviour characteristics: A case study of Beijing
1
2017
... 近年来,温室气体排放引起的全球气候变化,已日渐威胁到全球生态平衡和人类社会的可持续发展(Peters et al, 2011; Dong et al, 2017).控制CO2等温室气体的排放,已成为当前人类应对全球气候变化的重要任务(李富佳等, 2012; Li et al, 2017).目前,核算区域碳排放的方法一般采用《联合国气候变化框架公约》中提出的生产责任法,即因生产、出口和调出产品而排放的CO2包含在一个区域的碳排放账户里,但因进口和调入引起的碳排放却被排除在外.然而,随着区域间贸易,经济发达地区会通过区际贸易从经济落后地区调入高碳排放的产品,从而使经济发达地区表面上实现了碳减排,实际上却是以经济落后地区碳排放量增长为代价.而落后地区为了经济发展,必须长时间生产此类产品.发达地区虽然减排成效显著,但却加重了欠发达地区的碳减排压力.这种严重的双边贸易过程中隐含的碳转移问题既存在于国家之间,也广泛存在于经济体系相对独立的不同行政单元之间.区际碳排放转移直接导致了区域间在整体上不但没有实现碳减排,反而加剧了彼此碳减排权责的不公平、低效率和高成本.区际碳隐含转移问题对区域碳排放格局和碳减排效果影响重大,是造成区域间减排压力转嫁、整体减排效果抵消、碳排放净转出区经济增长负担加重和产业结构升级转型困难等问题的重要原因之一(Miller et al, 2009; 李富佳等, 2015). ...
Carbon emissions embodied in demand-supply chains in China
1
2015a
... 国内外学者对区间贸易隐含碳排放转移问题研究成果的大量出现,近年来引发了全球对区域间碳减排合作方式的全新思考(Chen et al, 2016).传统的固定区域碳排放削减措施由于没有充分考虑区域间的碳排放转移问题,导致一些地区为了减少碳排放,而从其他区域进口高碳排放的产品,这样的碳减排政策所产生的碳减排效果往往不能充分发挥作用,甚至可能造成局部减排,但总量反而增加,或者一个区域减排、多个区域增加的情况(Munksgaard, 2001; Zhong et al, 2018).因为在这种情形下,理论上如果一个国家完全通过进口国外制造的商品来代替国内生产,就会出现零碳排放的情况,而实际上对全球碳排放总量没有丝毫减少,甚至由于生产国技术水平差异,会造成全球碳排放总量的增加.也就是学术界所指出的区域间“碳泄漏”问题(Rhee et al, 2006; Liu et al, 2015a). ...
Carbon emissions embodied in value added chains in China
1
2015b
... 随着研究广泛开展,越来越多的学者意识到,在重视国际贸易的同时,还应该同样高度重视碳排放空间转移问题在另一个重要领域的重大研究价值,那就是一国之内各区域间贸易隐含的碳排放空间转移问题.中国有34个省级行政区,包括23个省、5个自治区、4个直辖市、2个特别行政区.省际之间贸易壁垒较小,省际贸易复杂、频繁且规模巨大,因此,对于中国而言,省际要素流动和经济联系对区域碳排放量的实际影响更加重要(Afton et al, 2011; Liu et al, 2015b; Cheng et al, 2018).研究省际贸易的碳排放转移问题,对于深入揭示中国碳排放形成原因,促进形成区际协同作用,高效发挥碳减排投入总体功效、科学合理地切实减少自身碳排放具有重要的理论和现实意义. ...
Targeted opportunities to address the climate-trade dilemma in China
1
2016
... 中国是全球最大的碳排放国,也是国际贸易大国,近年来国内外学者针对中国及其各省区对外进出口贸易隐含的碳排放空间转移研究日渐增多(Andersson, 2018).对Web of Science的搜索发现,1981-2017年,关于中国国际贸易隐含碳排放的相关研究达到317篇,占国际贸易隐含碳排放研究的85%,并从2010年开始呈现快速增长的态势,2017年相关的研究论文高达116篇(Zhang et al, 2017).而针对中国国际贸易隐含碳转移的研究成果再次说明,中国是承受全球碳泄漏最为严重的国家之一,区际贸易隐含碳转移,也是造成中国成为全球碳排放第一大国的关键原因之一(齐晔等, 2008; 潘安, 2017).如,Shui等(2006)通过研究中美之间国际贸易造成的碳排放空间迁移变化发现,1997-2003年7%~14%的中国CO2排放是由于美国消费需求扩大而引起中国相关产业生产扩张所造成的.张晓平(2009)计算了2000-2006年中国本土出口到美国消费的CO2排放量,显示美国和欧盟通过国际贸易净转移到中国的CO2排放量分别达到中国CO2 总排放的4.1%~5.1%和1.8%~4.0%.Zhao等(2016)分析了1995-2009年中国与美国双边贸易的隐含碳排放驱动机制,认为海外贸易需求是中国对美国的隐含碳排放快速增加的最主要驱动因素.Liu 等(2016)对中国国际碳转移量的量化研究也表明,2007年,中国由于生产供发达国家消费商品所产生的国际碳排放转移高达17亿t CO2,占自身工业排放总量的1/4;2013年,中国由于国际贸易而被转移的隐含碳排放总量大于日本或德国的全年碳排放总量,相当于全球排放量第5位. ...
Embodied carbon dioxide flow in international trade: A comparative analysis based on China and Japan
... 近年来,温室气体排放引起的全球气候变化,已日渐威胁到全球生态平衡和人类社会的可持续发展(Peters et al, 2011; Dong et al, 2017).控制CO2等温室气体的排放,已成为当前人类应对全球气候变化的重要任务(李富佳等, 2012; Li et al, 2017).目前,核算区域碳排放的方法一般采用《联合国气候变化框架公约》中提出的生产责任法,即因生产、出口和调出产品而排放的CO2包含在一个区域的碳排放账户里,但因进口和调入引起的碳排放却被排除在外.然而,随着区域间贸易,经济发达地区会通过区际贸易从经济落后地区调入高碳排放的产品,从而使经济发达地区表面上实现了碳减排,实际上却是以经济落后地区碳排放量增长为代价.而落后地区为了经济发展,必须长时间生产此类产品.发达地区虽然减排成效显著,但却加重了欠发达地区的碳减排压力.这种严重的双边贸易过程中隐含的碳转移问题既存在于国家之间,也广泛存在于经济体系相对独立的不同行政单元之间.区际碳排放转移直接导致了区域间在整体上不但没有实现碳减排,反而加剧了彼此碳减排权责的不公平、低效率和高成本.区际碳隐含转移问题对区域碳排放格局和碳减排效果影响重大,是造成区域间减排压力转嫁、整体减排效果抵消、碳排放净转出区经济增长负担加重和产业结构升级转型困难等问题的重要原因之一(Miller et al, 2009; 李富佳等, 2015). ...
CO2 accounts for open economies: Producer or consumer responsibility
1
2001
... 国内外学者对区间贸易隐含碳排放转移问题研究成果的大量出现,近年来引发了全球对区域间碳减排合作方式的全新思考(Chen et al, 2016).传统的固定区域碳排放削减措施由于没有充分考虑区域间的碳排放转移问题,导致一些地区为了减少碳排放,而从其他区域进口高碳排放的产品,这样的碳减排政策所产生的碳减排效果往往不能充分发挥作用,甚至可能造成局部减排,但总量反而增加,或者一个区域减排、多个区域增加的情况(Munksgaard, 2001; Zhong et al, 2018).因为在这种情形下,理论上如果一个国家完全通过进口国外制造的商品来代替国内生产,就会出现零碳排放的情况,而实际上对全球碳排放总量没有丝毫减少,甚至由于生产国技术水平差异,会造成全球碳排放总量的增加.也就是学术界所指出的区域间“碳泄漏”问题(Rhee et al, 2006; Liu et al, 2015a). ...
Austria's CO2 responsibility and the carbon content of its international trade
1
2010
... 在微观方面,也有大量学者以单一的国家或地区为案例,对碳排放跨区域转移量进行核算.其结论均证明了区域间贸易引起的碳排放迁移量,在区域碳排放总量中往往占据着不可忽视的比重,对单个国家和地区的碳排放总量和构成具有显著影响(Munoz et al, 2010; Bushnell et al, 2012; Cahill et al, 2012).如Schaeffer等(1996)对巴西 1970-1993 年非能源商品进出口中隐含的碳排放量进行了评估,证明巴西1980年以来一直保持着较高的净出口隐含碳排放量,而1990 年这部分碳排放量已占到巴西总碳排放量的11.4%.而Sánchez-Chóliz等(2004)对西班牙的研究也同样表明,西班牙在进口和出口贸易中隐含的碳排放量分别占到了总排放量的36%和37%.同样,Ståhls等(2011)对芬兰1991-2005年的国际贸易分析也显示,芬兰几乎所有的碳排放都是由于出口产品造成的.也就是说,碳排放净出口国在出口贸易过程中,承担了其他国家消费的碳排放;而碳排放净进口国家则在进口贸易中将自身所应承担的部分碳排放量转移到了其产品供应国. ...
China's balance of emissions embodied in trade: Approaches to measurement and allocating international responsibility
1
2008
... 这些研究成果揭示了国际贸易中隐含的碳排放空间转移对中国造成的实际影响,说明了中国作为全球最大碳排放国家并非完全为了自身发展而排放了全部的碳,而是同时承担了很大比重的其他国家发展所需的碳排放(Pan et al, 2008; Guo et al, 2012).这对理清中国碳排放账户,在国际碳减排博弈中争取自身应得利益起到了非常重要的作用,同时也为避免区域间碳泄漏,真正意义上减少全球碳排放总量提供了科学的依据. ...
From production-based to consumption-based national emission inventories
1
2008
... 基于这种认识,大量学者提出了应根据区域贸易关系特征,提出更科学的产业结构调整策略,制定更为合理的碳减排政策(Ferng, 2003; Peters et al, 2007; Peters, 2008; 钟章奇等, 2017; 余晓泓等, 2018).这些学者主张在碳减排的调控对策中,应充分考虑区域碳排放转移量,综合考虑不同地区的相对技术差异、贸易需求、贸易结构、贸易规模等影响因素,科学分析各类影响因素的影响机理和作用程度,科学制定碳减排调控对策(Peters et al, 2008b; Zhang Y X et al, 2014; Yang et al, 2017).但是,目前对隐含碳排放转移研究成果的应用还基本停留在宏观层面的权责协调领域.由于缺乏碳转移动态驱动机制的探索,无法深入剖析长期遭受“碳泄漏”的持续性、变化性、系统性复杂原因,更无法针对碳转移机制制定有效的产业调控方案,难以真正破解“碳泄漏”困境.然而,深入产业部门层面的碳转移调控对策研究,对产业结构转型升级的方向和具体方案制定给予实际的指导,却是此类研究成果最能体现价值的用武之地. ...
CO2 embodied in international trade with implications for global climate policy
Post-Kyoto greenhouse gas inventories: Production versus consumption
2
2008b
... 20世纪末期,大量学者在研究区域能源消耗和碳排放时发现,在经济全球化和国际贸易日趋密切的背景和趋势下,某产品消费国的消费需求变化往往会造成其所需产品生产国的能源消耗和碳排放量随之发生变化.虽然消费国自身的碳排放量很少,但其贸易引起的关联性能源消耗和碳排放量却可能很大(Williams et al,1987; Howarth et al, 1991; Peters et al, 2008b; 魏本勇等, 2009; Zhu et al, 2018).此后,越来越多的学者对贸易碳排放转移问题展开了大量研究.特别是近年来随着CO2 排放对全球变暖的影响引起全球的强烈关注(IPCC, 2006, 2007),全球碳减排合作不断加深、区域间在碳排放责任与减排目标等领域的博弈日趋激烈,贸易引发的碳排放空间转移问题开始逐渐成为学术界研究的一大热点(Wiedmann, 2009a, 2009b; Rüstemoğlu et al, 2016). ...
... 基于这种认识,大量学者提出了应根据区域贸易关系特征,提出更科学的产业结构调整策略,制定更为合理的碳减排政策(Ferng, 2003; Peters et al, 2007; Peters, 2008; 钟章奇等, 2017; 余晓泓等, 2018).这些学者主张在碳减排的调控对策中,应充分考虑区域碳排放转移量,综合考虑不同地区的相对技术差异、贸易需求、贸易结构、贸易规模等影响因素,科学分析各类影响因素的影响机理和作用程度,科学制定碳减排调控对策(Peters et al, 2008b; Zhang Y X et al, 2014; Yang et al, 2017).但是,目前对隐含碳排放转移研究成果的应用还基本停留在宏观层面的权责协调领域.由于缺乏碳转移动态驱动机制的探索,无法深入剖析长期遭受“碳泄漏”的持续性、变化性、系统性复杂原因,更无法针对碳转移机制制定有效的产业调控方案,难以真正破解“碳泄漏”困境.然而,深入产业部门层面的碳转移调控对策研究,对产业结构转型升级的方向和具体方案制定给予实际的指导,却是此类研究成果最能体现价值的用武之地. ...
Growth in emission transfers via international trade from 1990 to 2008
1
2011
... 近年来,温室气体排放引起的全球气候变化,已日渐威胁到全球生态平衡和人类社会的可持续发展(Peters et al, 2011; Dong et al, 2017).控制CO2等温室气体的排放,已成为当前人类应对全球气候变化的重要任务(李富佳等, 2012; Li et al, 2017).目前,核算区域碳排放的方法一般采用《联合国气候变化框架公约》中提出的生产责任法,即因生产、出口和调出产品而排放的CO2包含在一个区域的碳排放账户里,但因进口和调入引起的碳排放却被排除在外.然而,随着区域间贸易,经济发达地区会通过区际贸易从经济落后地区调入高碳排放的产品,从而使经济发达地区表面上实现了碳减排,实际上却是以经济落后地区碳排放量增长为代价.而落后地区为了经济发展,必须长时间生产此类产品.发达地区虽然减排成效显著,但却加重了欠发达地区的碳减排压力.这种严重的双边贸易过程中隐含的碳转移问题既存在于国家之间,也广泛存在于经济体系相对独立的不同行政单元之间.区际碳排放转移直接导致了区域间在整体上不但没有实现碳减排,反而加剧了彼此碳减排权责的不公平、低效率和高成本.区际碳隐含转移问题对区域碳排放格局和碳减排效果影响重大,是造成区域间减排压力转嫁、整体减排效果抵消、碳排放净转出区经济增长负担加重和产业结构升级转型困难等问题的重要原因之一(Miller et al, 2009; 李富佳等, 2015). ...
China's growing CO2 emissions: A race between increasing consumption and efficiency gains
1
2007
... 基于这种认识,大量学者提出了应根据区域贸易关系特征,提出更科学的产业结构调整策略,制定更为合理的碳减排政策(Ferng, 2003; Peters et al, 2007; Peters, 2008; 钟章奇等, 2017; 余晓泓等, 2018).这些学者主张在碳减排的调控对策中,应充分考虑区域碳排放转移量,综合考虑不同地区的相对技术差异、贸易需求、贸易结构、贸易规模等影响因素,科学分析各类影响因素的影响机理和作用程度,科学制定碳减排调控对策(Peters et al, 2008b; Zhang Y X et al, 2014; Yang et al, 2017).但是,目前对隐含碳排放转移研究成果的应用还基本停留在宏观层面的权责协调领域.由于缺乏碳转移动态驱动机制的探索,无法深入剖析长期遭受“碳泄漏”的持续性、变化性、系统性复杂原因,更无法针对碳转移机制制定有效的产业调控方案,难以真正破解“碳泄漏”困境.然而,深入产业部门层面的碳转移调控对策研究,对产业结构转型升级的方向和具体方案制定给予实际的指导,却是此类研究成果最能体现价值的用武之地. ...
Change in CO2 emission and its transmissions between Korea and Japan using international input-output analysis
1
2006
... 国内外学者对区间贸易隐含碳排放转移问题研究成果的大量出现,近年来引发了全球对区域间碳减排合作方式的全新思考(Chen et al, 2016).传统的固定区域碳排放削减措施由于没有充分考虑区域间的碳排放转移问题,导致一些地区为了减少碳排放,而从其他区域进口高碳排放的产品,这样的碳减排政策所产生的碳减排效果往往不能充分发挥作用,甚至可能造成局部减排,但总量反而增加,或者一个区域减排、多个区域增加的情况(Munksgaard, 2001; Zhong et al, 2018).因为在这种情形下,理论上如果一个国家完全通过进口国外制造的商品来代替国内生产,就会出现零碳排放的情况,而实际上对全球碳排放总量没有丝毫减少,甚至由于生产国技术水平差异,会造成全球碳排放总量的增加.也就是学术界所指出的区域间“碳泄漏”问题(Rhee et al, 2006; Liu et al, 2015a). ...
Determinants of CO2 emissions in Brazil and Russia between 1992 and 2011: A decomposition analysis
1
2016
... 20世纪末期,大量学者在研究区域能源消耗和碳排放时发现,在经济全球化和国际贸易日趋密切的背景和趋势下,某产品消费国的消费需求变化往往会造成其所需产品生产国的能源消耗和碳排放量随之发生变化.虽然消费国自身的碳排放量很少,但其贸易引起的关联性能源消耗和碳排放量却可能很大(Williams et al,1987; Howarth et al, 1991; Peters et al, 2008b; 魏本勇等, 2009; Zhu et al, 2018).此后,越来越多的学者对贸易碳排放转移问题展开了大量研究.特别是近年来随着CO2 排放对全球变暖的影响引起全球的强烈关注(IPCC, 2006, 2007),全球碳减排合作不断加深、区域间在碳排放责任与减排目标等领域的博弈日趋激烈,贸易引发的碳排放空间转移问题开始逐渐成为学术界研究的一大热点(Wiedmann, 2009a, 2009b; Rüstemoğlu et al, 2016). ...
CO2 emissions embodied in international trade: Evidence for Spain
1
2004
... 在微观方面,也有大量学者以单一的国家或地区为案例,对碳排放跨区域转移量进行核算.其结论均证明了区域间贸易引起的碳排放迁移量,在区域碳排放总量中往往占据着不可忽视的比重,对单个国家和地区的碳排放总量和构成具有显著影响(Munoz et al, 2010; Bushnell et al, 2012; Cahill et al, 2012).如Schaeffer等(1996)对巴西 1970-1993 年非能源商品进出口中隐含的碳排放量进行了评估,证明巴西1980年以来一直保持着较高的净出口隐含碳排放量,而1990 年这部分碳排放量已占到巴西总碳排放量的11.4%.而Sánchez-Chóliz等(2004)对西班牙的研究也同样表明,西班牙在进口和出口贸易中隐含的碳排放量分别占到了总排放量的36%和37%.同样,Ståhls等(2011)对芬兰1991-2005年的国际贸易分析也显示,芬兰几乎所有的碳排放都是由于出口产品造成的.也就是说,碳排放净出口国在出口贸易过程中,承担了其他国家消费的碳排放;而碳排放净进口国家则在进口贸易中将自身所应承担的部分碳排放量转移到了其产品供应国. ...
The embodiment of carbon associated with Brazilian imports and exports
1
1996
... 在微观方面,也有大量学者以单一的国家或地区为案例,对碳排放跨区域转移量进行核算.其结论均证明了区域间贸易引起的碳排放迁移量,在区域碳排放总量中往往占据着不可忽视的比重,对单个国家和地区的碳排放总量和构成具有显著影响(Munoz et al, 2010; Bushnell et al, 2012; Cahill et al, 2012).如Schaeffer等(1996)对巴西 1970-1993 年非能源商品进出口中隐含的碳排放量进行了评估,证明巴西1980年以来一直保持着较高的净出口隐含碳排放量,而1990 年这部分碳排放量已占到巴西总碳排放量的11.4%.而Sánchez-Chóliz等(2004)对西班牙的研究也同样表明,西班牙在进口和出口贸易中隐含的碳排放量分别占到了总排放量的36%和37%.同样,Ståhls等(2011)对芬兰1991-2005年的国际贸易分析也显示,芬兰几乎所有的碳排放都是由于出口产品造成的.也就是说,碳排放净出口国在出口贸易过程中,承担了其他国家消费的碳排放;而碳排放净进口国家则在进口贸易中将自身所应承担的部分碳排放量转移到了其产品供应国. ...
The role of CO2 embodied in US-China trade
1
2006
... 中国是全球最大的碳排放国,也是国际贸易大国,近年来国内外学者针对中国及其各省区对外进出口贸易隐含的碳排放空间转移研究日渐增多(Andersson, 2018).对Web of Science的搜索发现,1981-2017年,关于中国国际贸易隐含碳排放的相关研究达到317篇,占国际贸易隐含碳排放研究的85%,并从2010年开始呈现快速增长的态势,2017年相关的研究论文高达116篇(Zhang et al, 2017).而针对中国国际贸易隐含碳转移的研究成果再次说明,中国是承受全球碳泄漏最为严重的国家之一,区际贸易隐含碳转移,也是造成中国成为全球碳排放第一大国的关键原因之一(齐晔等, 2008; 潘安, 2017).如,Shui等(2006)通过研究中美之间国际贸易造成的碳排放空间迁移变化发现,1997-2003年7%~14%的中国CO2排放是由于美国消费需求扩大而引起中国相关产业生产扩张所造成的.张晓平(2009)计算了2000-2006年中国本土出口到美国消费的CO2排放量,显示美国和欧盟通过国际贸易净转移到中国的CO2排放量分别达到中国CO2 总排放的4.1%~5.1%和1.8%~4.0%.Zhao等(2016)分析了1995-2009年中国与美国双边贸易的隐含碳排放驱动机制,认为海外贸易需求是中国对美国的隐含碳排放快速增加的最主要驱动因素.Liu 等(2016)对中国国际碳转移量的量化研究也表明,2007年,中国由于生产供发达国家消费商品所产生的国际碳排放转移高达17亿t CO2,占自身工业排放总量的1/4;2013年,中国由于国际贸易而被转移的隐含碳排放总量大于日本或德国的全年碳排放总量,相当于全球排放量第5位. ...
Impacts of international trade on carbon flows of forest industry in Finland
1
2011
... 在微观方面,也有大量学者以单一的国家或地区为案例,对碳排放跨区域转移量进行核算.其结论均证明了区域间贸易引起的碳排放迁移量,在区域碳排放总量中往往占据着不可忽视的比重,对单个国家和地区的碳排放总量和构成具有显著影响(Munoz et al, 2010; Bushnell et al, 2012; Cahill et al, 2012).如Schaeffer等(1996)对巴西 1970-1993 年非能源商品进出口中隐含的碳排放量进行了评估,证明巴西1980年以来一直保持着较高的净出口隐含碳排放量,而1990 年这部分碳排放量已占到巴西总碳排放量的11.4%.而Sánchez-Chóliz等(2004)对西班牙的研究也同样表明,西班牙在进口和出口贸易中隐含的碳排放量分别占到了总排放量的36%和37%.同样,Ståhls等(2011)对芬兰1991-2005年的国际贸易分析也显示,芬兰几乎所有的碳排放都是由于出口产品造成的.也就是说,碳排放净出口国在出口贸易过程中,承担了其他国家消费的碳排放;而碳排放净进口国家则在进口贸易中将自身所应承担的部分碳排放量转移到了其产品供应国. ...
Input-output analysis of CO2 emissions embodied in trade: The effects of spatial aggregation
Embodied carbon emission analysis of eco-industrial park based on input-output analysis and ecological network analysis
1
2017
... 基于这种认识,大量学者提出了应根据区域贸易关系特征,提出更科学的产业结构调整策略,制定更为合理的碳减排政策(Ferng, 2003; Peters et al, 2007; Peters, 2008; 钟章奇等, 2017; 余晓泓等, 2018).这些学者主张在碳减排的调控对策中,应充分考虑区域碳排放转移量,综合考虑不同地区的相对技术差异、贸易需求、贸易结构、贸易规模等影响因素,科学分析各类影响因素的影响机理和作用程度,科学制定碳减排调控对策(Peters et al, 2008b; Zhang Y X et al, 2014; Yang et al, 2017).但是,目前对隐含碳排放转移研究成果的应用还基本停留在宏观层面的权责协调领域.由于缺乏碳转移动态驱动机制的探索,无法深入剖析长期遭受“碳泄漏”的持续性、变化性、系统性复杂原因,更无法针对碳转移机制制定有效的产业调控方案,难以真正破解“碳泄漏”困境.然而,深入产业部门层面的碳转移调控对策研究,对产业结构转型升级的方向和具体方案制定给予实际的指导,却是此类研究成果最能体现价值的用武之地. ...
Temporal and spatial variations in consumption-based carbon dioxide emissions in China
1
2014
... 基于这种认识,大量学者提出了应根据区域贸易关系特征,提出更科学的产业结构调整策略,制定更为合理的碳减排政策(Ferng, 2003; Peters et al, 2007; Peters, 2008; 钟章奇等, 2017; 余晓泓等, 2018).这些学者主张在碳减排的调控对策中,应充分考虑区域碳排放转移量,综合考虑不同地区的相对技术差异、贸易需求、贸易结构、贸易规模等影响因素,科学分析各类影响因素的影响机理和作用程度,科学制定碳减排调控对策(Peters et al, 2008b; Zhang Y X et al, 2014; Yang et al, 2017).但是,目前对隐含碳排放转移研究成果的应用还基本停留在宏观层面的权责协调领域.由于缺乏碳转移动态驱动机制的探索,无法深入剖析长期遭受“碳泄漏”的持续性、变化性、系统性复杂原因,更无法针对碳转移机制制定有效的产业调控方案,难以真正破解“碳泄漏”困境.然而,深入产业部门层面的碳转移调控对策研究,对产业结构转型升级的方向和具体方案制定给予实际的指导,却是此类研究成果最能体现价值的用武之地. ...
Exploring the characteristics of CO2 emissions embodied in international trade and the fair share of responsibility
1
2018
... 20世纪末期,大量学者在研究区域能源消耗和碳排放时发现,在经济全球化和国际贸易日趋密切的背景和趋势下,某产品消费国的消费需求变化往往会造成其所需产品生产国的能源消耗和碳排放量随之发生变化.虽然消费国自身的碳排放量很少,但其贸易引起的关联性能源消耗和碳排放量却可能很大(Williams et al,1987; Howarth et al, 1991; Peters et al, 2008b; 魏本勇等, 2009; Zhu et al, 2018).此后,越来越多的学者对贸易碳排放转移问题展开了大量研究.特别是近年来随着CO2 排放对全球变暖的影响引起全球的强烈关注(IPCC, 2006, 2007),全球碳减排合作不断加深、区域间在碳排放责任与减排目标等领域的博弈日趋激烈,贸易引发的碳排放空间转移问题开始逐渐成为学术界研究的一大热点(Wiedmann, 2009a, 2009b; Rüstemoğlu et al, 2016). ...


