李致颖 , 方海燕
, 方海燕
LI Zhiying, FANG Haiyan
通讯作者:
版权声明: 2017 地理科学进展 《地理科学进展》杂志 版权所有
基金资助:
作者简介:
作者简介:李致颖(1992-),女,广西南宁人,硕士研究生,主要从事土壤侵蚀与水土保持研究,E-mail: lizy.14s@igsnrr.ac.cn。
展开
摘要
为科学地认识中国东北黑土区流域土壤侵蚀特征,探讨TETIS模型在该区的适用性,本文以乌裕尔河流域为例,利用1971-1987年日径流与泥沙实测数据对TETIS模型进行了校正与验证,进而分析了流域土壤侵蚀强度特征及其与坡度、土地利用方式的关系。研究结果表明:TETIS模型在乌裕尔河流域适用性好,日径流与日输沙量的纳什效率系数在0.52~0.70之间,决定系数在0.60~0.71之间,体积误差均不超过15%。流域平均侵蚀模数为397.2 t/(km2·a),流域以微度和轻度侵蚀为主,约90%的产沙来自于坡面。平均土壤侵蚀模数随坡度的增大而增大,流域侵蚀量主要来自于0°~5°坡面。不同土地利用方式具不同的土壤侵蚀模数,耕地土壤侵蚀模数最大,达556.3 t/(km2·a)。坡度较大的耕地和植被覆盖度较低的区域是水土流失治理的重点。研究表明,TETIS模型在黑土区模拟土壤侵蚀产沙应用前景好,可为研究区制定水土保持措施提供科学依据。
关键词:
Abstract
In order to understand the characteristics of soil erosion in a basin and explore the applicability of the TETIS model for simulating runoff and sediment yield in the black soil region of Northeast China, the Wuyuer River Basin was taken as an example in this study. Daily runoff and sediment discharge data series from 1971 to 1987 were used to calibrate and validate the TETIS model. On this basis, characteristics of soil erosion intensity and their relationships with slope and land use types in the basin were analyzed. The results show that the TETIS model has good applicability in the Wuyuer River Basin. Nash-Sutcliffe efficiency coefficients of daily discharge and sediment ranged from 0.52 to 0.70, coefficients of determination ranged from 0.60 to 0.71, and volume errors were no more than 15%. Average soil erosion intensity was 397.2 t/(km2·a) in the basin. Slight erosion and light erosion were the dominant soil erosion types and about 90% of sediment yield was from hillslope. Average erosion intensity increased with increasing slope gradients. Slopes of 0°~5° were the main erosion area in the basin. Different land use types have different soil erosion intensities and arable land has the highest value (556.3 t/(km2·a)). Priority of erosion control should focus on the arable lands with steep slopes and low vegetation covered regions. Comparison of these simulation results with other study results in the black soil region of Northeast China demonstrates a promising future of the TETIS model for simulating runoff and sediment yields in the region. This study may provide a scientific basis for the implementation of soil and water conservation measures in the study area.
Keywords:
土壤侵蚀是世界性的环境问题之一(唐克丽, 2004),可引起土地资源退化、土壤养分流失、泥沙淤积、洪涝灾害等问题,严重影响着生态环境和人类的可持续发展(吴发启等, 2012)。东北黑土区是中国的粮食主产区,然而,由于长期不合理的开垦与耕作,加之东北黑土区独特的土壤地理环境(崔明等, 2008),该区土壤侵蚀问题日趋剧烈,威胁到中国的粮食安全。
土壤侵蚀模型是定量评价水土流失及指导水土保持规划的有效工具(雷廷武等, 2012)。东北黑土区土壤侵蚀研究开展较晚,模型模拟研究也不足。截至目前,东北黑土区土壤侵蚀模型模拟研究多采用(R)USLE((Revised) Universal Soil Loss Equation)模型(李浩, 2012; 胡刚等, 2015; 李百安, 2015),但运用(R)USLE模型计算年均土壤侵蚀量,对特定年份或场次降雨计算误差较大(陈云明等, 2004)。盛美玲等(2015)采用WaTEM/SEDEM(Water and Tillage Erosion Model and Sediment Delivery Model)分布式模型开展小流域土壤侵蚀研究,但该模型仅能模拟流域多年平均侵蚀产沙情况,难以获取年及以下更小时间尺度上产流产沙过程(盛美玲等, 2014)。此外,WEPP (Water Erosion Prediction Project)模型在东北黑土区也仅在坡面尺度(刘远利, 2010)和小流域(魏守才, 2015)开展研究。汤洁等(2014)应用SWAT(Soil and Water Assessment Tool)模型在辽河支流招苏台河流域进行土壤侵蚀研究,尽管SWAT模型能较为准确地模拟流域产流产沙,但由于该模型是基于水文响应单元模拟产流产沙,缺少沟道侵蚀模块,致使SWAT模型难以模拟流域内各点及沟道的侵蚀特征。因此,十分有必要探讨其他模型在东北黑土区的适用性,以期为更准确地预报侵蚀产沙,进而为有效地实施水土保持措施提供依据。
西班牙瓦伦西亚科技大学开发的TETIS模型(Francés et al, 2007)是一个能模拟径流、土壤侵蚀与泥沙沉积及其空间特征的分布式模型,可模拟坡面和沟道侵蚀,且结构简单灵活,数据要求不高,校正参数较少。因而,自1994年提出以来,该模型在西班牙(Salazar et al, 2012; Bussi, Francés, Horel, et al, 2014; Rodriguez-Lloveras et al, 2016)、美国(Bussi, Francés, Montoya, et al, 2014)、意大利(Coccia et al, 2011)、瑞士和法国(Ruiz-Villanueva et al, 2015)等得到了成功应用,研究涉及径流模拟、土壤侵蚀模拟、水土保持措施效应评价、气候变化下的水沙效应等方面。TETIS模型的有效性、适用性与灵活性在国际应用研究中已得到了有效验证,但在国内仍未见报道。
因此,本文拟以乌裕尔河流域为研究区域,将TETIS模型引进东北黑土区,利用该模型模拟流域侵蚀产沙特征,探讨该模型在黑土区的适用性,分析不同土地利用方式与不同坡度下的土壤侵蚀规律。本文可为丰富黑土区土壤侵蚀模拟研究,深入揭示黑土区土壤侵蚀规律,为中国东北黑土区有效实施水土保持提供科学支撑。
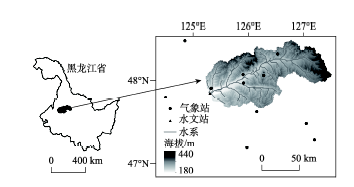
乌裕尔河属嫩江水系一级支流,发源于小兴安岭西麓山区(127°30′E, 47°54′N),为黑龙江省内最大的内陆河(图1)。流域内坡度较缓,多为低山丘陵、坡状台地和漫川漫岗。乌裕尔河上游区域具备基本的河流特征,下游河水排泄不畅,形成沼泽与湿地。将乌裕尔河依安水文站(125°29′E, 47°52′N)控制流域作为研究区域,流域面积为7366 km2。
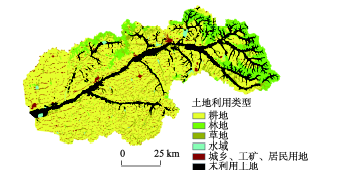
研究区域属温带大陆性季风气候,年均温2.1 ℃,年降水量460 mm左右,蒸发强烈。降雨年内分布不均,约80%集中在6-9月。流域内主要土壤有黑土、暗棕壤、黑钙土、草甸土、沼泽土5个土类。其中,黑土是该区分布最广的土壤类型,自然肥力较高,非常有利于农作物机耕作业。流域内主要土地类型为耕地,占全区面积66% (图2)。据文献记载,研究区存在沟壑纵横、切割耕地的现象,流域内共有侵蚀沟24678条,较大的2600条侵蚀沟占地10 km2,90%的侵蚀沟仍在发展(方海燕等, 2009; 王文娟等, 2012)。
TETIS是一个基于概念的分布式水文/泥沙模型,包括水文模块和泥沙模块两部分。水文模块基于水箱结构模拟产流过程,每个栅格有七层水箱,各代表不同的水文过程,包括融雪、植被截留、土壤毛管水层、地表水层、壤中流水层、蓄水层和河网水层。融雪过程根据经典的度日模型(Degree-day Method)建立。度日模型根据某一时段内的正积温和度日因子的乘积来计算该时段内的雪水当量。产流过程为:降水或融雪经植被截留后,首先进入土壤毛管水层,此水层中的水量仅能由蒸发流失,其余水流根据土壤下渗能力,分为地表径流、壤中流和基流,壤中流和基流量与不同层次土壤的水平渗流能力有关,三部分水量共同参与河网汇流。深层地下水流由于水量较小,且在深层土壤中散失,不参与汇流,但计入水量平衡中。水量平衡关系为流域收入水量(降雨量)与支出水量(蒸发量、地表径流量、壤中流量、基流量和深层地下水渗漏量)之差额等于各层水箱蓄水变化总量。汇流过程基于地貌动力波理论(Francés et al, 2007)与河网水力几何形态关系(Leopold et al, 1953)进行模拟。该过程将流域分为若干段河道,在一段时间内停留在某段河道的水量等于进入该河道的水量与汇入下一级河道水量之差,产汇流交错循环模拟。模型水箱结构简单,灵活性强,可根据流域地理环境,如是否存在融雪、植被截留及深层下渗等,调整水箱数量,以达到简化校正过程目的(Bussi et al, 2013)。
TETIS模型的泥沙模块基于CASC2D-SED模型(Sánchez, 2002)构建。CASC2D-SED是一个能够模拟坡面与沟/河道侵蚀的模型,该模块分为坡面输沙过程和沟/河道输沙过程。流域出口的产沙量取决于流域内泥沙量和径流输沙能力两大因素。TETIS模型将泥沙颗粒分为三种粒级,即砂粒、粉粒和粘粒,其中值粒径分别为0.35、0.016和0.001 mm,沉降速度分别为36、0.22和8.6×10⁻⁴ mm/s。坡面输沙过程中,对于一个边长为W的栅格,在单位时间内,栅格能产生的泥沙体积Qh由式(1)计算,式(1)的原型为Kilinc-Richardson方程(Kilinc et al, 1973),原方程仅考虑径流、坡度、土壤类型和土地利用类型的影响,修正后的公式考虑了土壤侵蚀因子的影响。坡面输沙能力Qh(m3/s)为:
式中:
坡面输沙能力根据土壤/泥沙质地组成,即砂粒、粉粒和粘粒的百分比含量,相应地也分为三部分粒级输沙能力。各部分输沙能力运移对应粒级的泥沙。泥沙颗粒根据各级颗粒沉降速度、河道水深和给定的时间间隔,分为悬浮泥沙和沉积泥沙。各级颗粒独立沉降,互不影响。输沙过程中,悬浮泥沙首先被搬运,若还有输移能力剩余,则继续带动沉积泥沙,最后侵蚀土壤母质,给定时间间隔内的悬浮泥沙的沉积量加入到沉积泥沙量中。坡面输沙过程的这种假定不仅解决了流域产沙和产流输沙能力有限情况下的泥沙输移量计算,也考虑了回水区域悬浮泥沙的连续沉降。
河道输沙过程与坡面输沙过程类似,但河道部分只考虑悬浮质和床沙质的搬运。悬浮质仍优先被搬运,剩余运移能力搬运床沙质,如若还有运移能力剩余,这部分运移能力将不再使用。河道输沙过程由Engelund-Hansen方程(Engelund et al, 1967)计算,输沙能力与水力半径、径流流速、粒径特征等有关。单位时间内,河道能够输移的粒级i泥沙颗粒的体积
式中:
TETIS模型根据汇水面积临界值划分坡面与沟/河道。汇水面积大小表示沟谷中来水量的多少。当上游栅格产流汇入汇水面积大于定义临界值的栅格时,则认为沟道开始发育,水流汇入沟/河道。本文根据黑土区相关研究(胡刚等, 2006; 盛美玲等, 2014; Fang, 2016),分别取0.4 km2和1 km2为沟道和河道的汇水面积临界值。除坡面与沟/河道输沙能力外,流域出水口产沙量还与河网中含沙量密切相关。因此,TETIS模型泥沙模块对河网中初始泥沙沉积量较为敏感。初始泥沙沉积量多,产沙量则可能增大。模型模拟过程中可通过模型预热或校正初始泥沙沉积量两种方式获取较为准确的初始值。本文采用预热的方式获得初始值。预热是指在初始状态空白的情况下,使用一段时间的数据进行模拟,获取模拟结束后的泥沙沉积量,这一段时间的模拟称为预热期,获取的泥沙沉积量则作为校正期的初始状态。预热的目的是为了降低初值条件不确定性的影响。预热期长度取决于模型的复杂程度,对于概念模型,预热期一般为一年(Le Lay et al, 2005; Seibert et al, 2012; Kim et al, 2016)。TETIS模型既可作为场次洪水事件模拟模型,也可作为连续时段模拟模型。作为连续时段模拟时,基本模拟步长为日步长。
TETIS模型输入数据包括气象数据(txt格式)、水沙数据(txt格式)以及其他反映流域地理特征的空间分布图(asc格式)。气象数据包括逐日平均气温、最高最低气温和雪水当量。其中气温数据来自中国气象数据网;雪水当量指积雪完全融化后得到的水层的垂直深度,等于雪密度与积雪深度的乘积。逐日积雪深度数据来自寒区旱区科学数据中心,雪密度数据来自马丽娟等(2012)。气象数据为站点数据,模型利用反距离权重法,插值得到流域的气象数据空间分布图。1970-1987年为依安站较长时间的具连续水沙数据序列的年份,因此选择该时间段序列的逐日水沙数据率定和验证模型。水沙数据来自中华人民共和国水文年鉴。其他空间分布图包括DEM、土壤图、土壤质地图、土地类型图、地质图、USLE-K、USLE-C、USLE-P分布图等。其中,DEM从1:5万地形图数字化而得,初始分辨率为20 m×20 m,但该分辨率已超出模型计算能力,需重采样至合适的分辨率。Shrestha等(2006) 研究表明,当IC比,即输入栅格面积(Input Grid Area)和流域面积(Catchment Area)之比不高于1:10时,分布式水文模型模拟效果较好。代表单元面积(REA)也是确定栅格尺寸的一种方法(Wood et al, 1988)。Woods等(1995)研究表明,REA阈值尺度为5~10 km2的量级。最终本文将DEM重采样为200 m×200 m,IC比小于1:10,栅格面积(0.04 km2)也小于REA,且模型计算效率在使用者可接受范围内。
土壤图与土地利用类型图(1985年,图2)分辨率分别为1:100万和1:10万,均来自中国科学院资源环境科学数据中心。土地利用图年份根据水沙数据序列(1970-1987年)选择,该时间序列内有两期土地利用图(1975年和1985年),但1975年土地利用图精度较低,且流域内有部分缺失,将1975年与1985年土地利用图重叠部分对比发现且两期土地利用类型变化不大,整体变化趋势为草地略有减少,建筑面积略有增加,且两期土地利用图中,耕地均为流域内主要土地利用类型。考虑到模型输入数据的完整性和精度问题,最终选择1985年作为土地利用图输入。
土壤质地,即每种土壤类型各级颗粒的百分含量,可通过查阅中国土种数据库得到。地质图由1:100万黑龙江省地质图数字化得到。USLE-K因子根据Sharpley等(1990)在EPIC模型中提出的公式(式(4)),利用土壤有机碳及颗粒组成资料计算。USLE-C因子与USLE-P因子根据研究区土地利用图,并参考乌裕尔河流域及东北黑土区已发表文献(魏建兵等, 2006; 王文娟等, 2012; 鄂立思等, 2015; 盛美玲等, 2015)获取(表1)。由于TETIS模型泥沙模块输入输出均为体积单位(m3/s),需将泥沙监测站监测重量单位(kg/s)进行转换,根据黑土区研究成果(Xie et al, 2007; Wang et al, 2011),同时参考研究区内各土壤类型容重值,最终取泥沙容重为1.2 g/cm3。
式中:K为USLE方程中的土壤可蚀性因子,
模拟开始前,需要将各个图层,如DEM、坡度图、土地利用类型图等,集成为一个地形土壤文件(sds格式),这一集成文件反映了流域内地理情况的空间异质性。TETIS模型为分布式模型,理论上需要针对每一栅格进行各个水箱的校正,但集成地形土壤文件可减少校正参数数量。假设流域内有n个栅格,每一栅格有p个校正系数,集成文件可使校正参数由原来的np个降为p个,提高了模型校正效率。
表1 研究区作物管理因子C值和治理措施因子P值
Tab.1 Values of crop management factor (C) and conservation practice factor (P) in the study area
| 土地利用类型 | C值 | P值 |
|---|---|---|
| 有林地 | 0.005 | 1 |
| 灌木林 | 0.07 | 1 |
| 疏林和其他林地 | 0.05 | 1 |
| 高覆盖草地 | 0.04 | 1 |
| 中覆盖草地 | 0.08 | 1 |
| 水域 | 0 | 0 |
| 城镇用地、其他建设用地、沼泽地 | 0 | 1 |
| 农村居民点 | 0.03 | 1 |
| 裸土地、裸岩石砾地 | 1 | 1 |
| 水田 | 0.18 | 0.03 |
| 旱地 | 1 | 0.352 |
根据式(1)、(3)可知,TETIS模型泥沙模块校正参数有3个,分别为坡面校正参数
表2 泥沙模块参数及取值
Tab.2 Parameters for sedimentological sub-model and their values
| 参数名称 | 参数范围 | 最终值 |
|---|---|---|
| 坡面输沙校正参数 | (1×10⁻⁸)~10 | 4.700 |
| 沟道输沙校正参数 | (1×10⁻⁸)~10 | 0.070 |
| 河道输沙校正参数 | (1×10⁻⁸)~10 | 0.004 |
模型模拟精度根据3个指标来评价,分别为体积误差(VE)、决定系数(R2)和纳什效率系数(NSE)。
式中:
以1970年作为预热期,首先估计了径流与泥沙的初始变量,进而分别选用1971-1977年和1978-1987年作为校正和验证期,通过人工试错与计算机自动率定相结合的方法,对模型径流和泥沙模拟进行校准和验证。
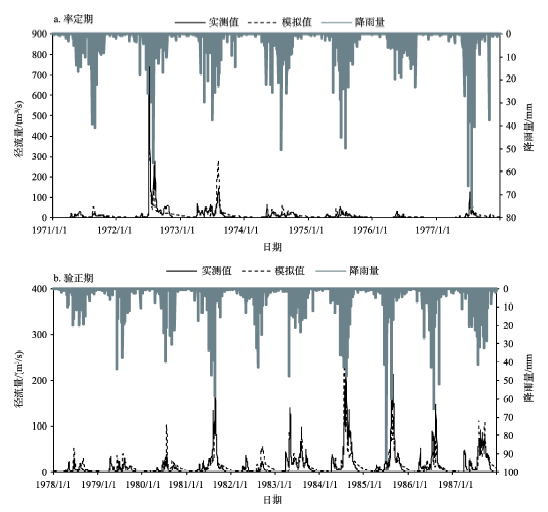
研究发现,日径流模拟值与实测值吻合很好。率定期日径流NSE为0.69,R2为0.69,VE为9.53%;验证期NSE为0.70,R2为0.71,VE为1.19%。TETIS模型模拟的径流流量过程线与实测结果整体非常吻合,相关性也较高(图3)。将日模拟结果分别处理为月步长和年步长,月步长率定期和验证期的效率系数分别为0.80和0.78,年步长率定期和验证期的NSE分别为0.84和0.82。研究表明,对径流模拟而言,若NSE≥0.5,R2≥0.6,VE≤10%,则认为模型模拟效果满意(Moriasi et al, 2007),因此,TETIS模型的模拟结果令人满意。相比于黑土区其他研究,TETIS模型的精度也较高。如张爱静(2013)在黑龙江省汤旺河流域应用SWAT模型进行流域产流模拟时,年步长上模拟NSE为0.85,月步长上为0.74。仕玉治(2011)将SWAT模型应用于松花江支流辉发河流域,年步长上NSE为0.89,月步长仅为0.62。TETIS模型在日、月、年步长上,率定期和验证期的NSE和R2约为0.7,VE均小于10%,表明TETIS模型在模拟流域出口产流时模拟精度较高,适用性好。
图3 率定期(a)与验证期(b)径流模拟值与实测值对比
Fig.3 Comparison of the simulated and observed water discharges in the calibration (a) and validation (b) periods
然而,模型对年内部分径流模拟效果不够理想,高估和低估现象均有存在。受融雪影响,流域实测径流在3-5月出现小峰值,但模型低估了流域的融雪径流。这可能是因为模型融雪模块度日模型较为简单,并未考虑风速、风向、空气湿度和雪颗粒生长等影响因素。另外,部分年份,如1973和1982年,洪峰出现高估现象,原因可能是前一年为丰水年,降雨突增,进而影响到次年的模拟精度。
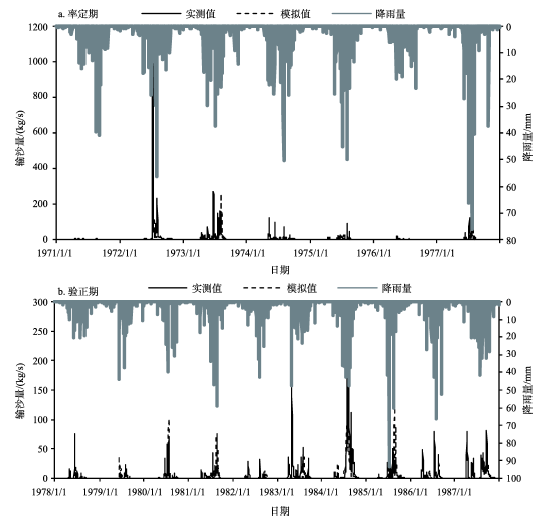
图4 率定期(a)与验证期(b)输沙模拟值与实测值对比
Fig.4 Comparison of the simulated and observed sediment discharges in the calibration (a) and validation (b) periods
流域1971-1987年日产沙模拟发现,率定期NSE为0.60,R2为0.69,验证期NSE为0.52,R2为0.60,率定期和验证期的体积误差均小于15%(表3),满足模型泥沙模拟VE≤15%、NSE≥0.5、R2≥0.6的标准(Moriasi et al, 2007),TETIS模型对流域产沙的模拟精度较高。图4显示,泥沙模拟值与实测值过程线吻合较好。然而,泥沙的模拟精度不如径流模拟精度高,VE值较径流模拟时偏低,高低估现象出现时期基本与径流模拟相符。究其原因,一是因为泥沙和径流间存在非线性关系,校正/验证时段内径流量估计的误差会带入泥沙模块中,进而形成误差(Rodriguez-Lloveras et al, 2015);二是TETIS模型泥沙模块尚未考虑重力侵蚀(Bussi, Francés, Horel, et al, 2014),而东北黑土区水力侵蚀和重力侵蚀具叠加作用也是造成土壤侵蚀严重的原因之一(张晓平等, 2006)。同时,重采样DEM可能导致高程变化趋于不明显,使得提取的河道总长度发生变化,源头区的支流趋于减少,进而导致产流产沙量进一步降低(高玉芳等, 2015)。但总体来看,模型整体的低估现象在可接受范围内。
表3 乌裕尔河依安站控制流域泥沙模拟结果
Tab.3 Results of sediment simulation of Yi'an Station in the Wuyuer River Basin
| 模拟时期 | NSE | R2 | VE/% | ||||||||
|---|---|---|---|---|---|---|---|---|---|---|---|
| 日值 | 月值 | 年值 | 日值 | 月值 | 年值 | 日值 | 月值 | 年值 | |||
| 率定期(1971-1977) | 0.60 | 0.77 | 0.92 | 0.69 | 0.88 | 0.97 | -6.93 | -7.19 | -5.65 | ||
| 验证期(1978-1987) | 0.52 | 0.74 | 0.82 | 0.60 | 0.73 | 0.90 | -14.41 | -14.62 | -14.40 | ||
将流域日模拟结果分别处理为月步长与年步长,发现月步长上泥沙模拟率定期和验证期的NSE分别为0.77和0.74,年步长上率定期和验证期的NSE分别为0.92和0.82,同样符合精度要求。盛美玲等(2015)应用WATEM/SEDEM模型对东北黑土区14个水库控制流域进行了产沙的校正和验证,发现年尺度上NSE达0.91。汤洁等(2014)将SWAT模型应用于辽河支流招苏台河流域的月步长模拟,泥沙模拟NSE在率定期和验证期分别为0.54和0.67。然而,这2个模型均没有实现日步长的模拟,文中TETIS模型在日步长上NSE可达0.52,月步长上达0.74。因此,与黑土区流域尺度上其他模型模拟对比表明,TETIS模型模拟精度更高。
此外,模型模拟发现,依安水文站控制流域泥沙输移比(SDR)为0.056,说明大量的侵蚀颗粒在到达流域出水口前已经沉积,这与研究区尺度较大及坡度较缓有关。简金世(2011)利用RUSLE模型计算得到依安站控制流域多年平均SDR为0.08;高燕等(2016)利用CSLE模型得到松花江流域SDR与流域面积(A)计算模型为SDR=1.25A-0.41,代入本研究区流域面积(7366 km2),结果为0.032,均与本文模型估算结果类似,再次验证了TETIS模型在东北黑土区泥沙模拟的适用性。
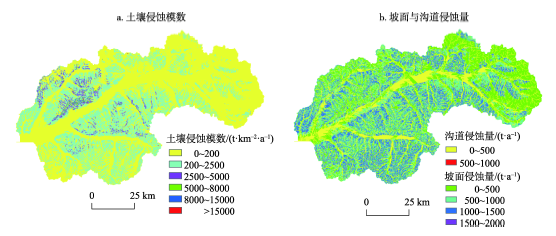
TETIS模型可获取各栅格单元上的土壤侵蚀量,利用软件matlab 8.3将其转换为asc码栅格文件,在Arcmap中可视化,并根据1997年水利部颁发的土壤侵蚀强度分布标准,获取乌裕尔河流域土壤侵蚀强度分布特征(图5a)。结果发现,乌裕尔河流域平均土壤侵蚀模数为397.2 t/(km2·a),已超过东北黑土区允许土壤流失量200 t/(km2·a)。盛美玲等(2015)以乌裕尔河流域东南部拜泉县齐心水库控制流域为研究对象,利用WATEM/SEDAM模型模拟得到该流域侵蚀模数为351.2 t/(km2·a);在乌裕尔河流域克山县古城小流域,孟凡影等(2015)基于GIS技术与RUSLE模型得到流域平均土壤侵蚀模数为344.3 t/(km2·a),均与本文结果类似。从表4可见,乌裕尔河流域微度侵蚀和轻度侵蚀所占比例最大。其中微度侵蚀面积为4657.92 km2,占流域面积的63.23%,主要分布在流域上中游及下游河道。这是因为流域上游土地利用类型多为林地,水土保持效应较好,下游河道主要表现为淤积,侵蚀强度不高。轻度侵蚀面积为2478.96 km2,占流域面积的33.65%,主要分布在河流流经的两侧,地貌类型多为丘陵及平原区,适合耕地利用,土地利用开发程度高,土壤侵蚀潜力较大。土壤侵蚀面积随着土壤侵蚀强度增大而减小,中度侵蚀强度以上面积总和为229.52 km2,占流域面积不足10%,主要分布在坡度较大的耕地,这些地区在夏季降雨集中的时期极易发生水土流失。
表4 乌裕尔河流域土壤侵蚀强度分级
Tab.4 Classification of soil erosion intensity in the Wuyuer River Basin
| 土壤侵蚀级别 | 土壤侵蚀强度/[t/(km2·a)] | 面积/km2 | 百分比/% |
|---|---|---|---|
| 微度 | 0~200 | 4657.92 | 63.23 |
| 轻度 | 200~2500 | 2478.96 | 33.65 |
| 中度 | 2500~5000 | 189.60 | 2.57 |
| 强烈 | 5000~8000 | 30.64 | 0.42 |
| 极强烈 | 8000~15000 | 8.48 | 0.12 |
| 剧烈 | >15000 | 0.80 | 0.01 |
图5b显示,乌裕尔河流域以坡面侵蚀为主,坡面侵蚀量占流域总侵蚀量的93.1%,沟道侵蚀仅占流域总侵蚀量的6.9%,这可能是因为沟道侵蚀面积占整个流域面积占比较小。实际上流域内侵蚀沟发育潜力很大,但大尺度上较难反映,小尺度流域能更好地反映沟蚀的分布特征。如王文娟等(2012)在高精度遥感影像和野外调查工作基础上,分析得出乌讷流域侵蚀沟主要是微度和轻度侵蚀,但发展程度剧烈。在研究区齐心水库小流域,沟道产沙量可占流域总产沙的43.9% (Fang, 2015)。本文使用的重采样的DEM可能导致模型对坡面和沟道的判别产生一定影响,例如一个栅格(0.04 km2)内可能同时存在坡面和沟道,但模型无法反映单个栅格内的异质性。但总体来看,模型对乌裕尔河流域坡面侵蚀占主导地位的现象把握较好,考虑的沟道侵蚀也有利于提高总侵蚀量的模拟精度。
图5 乌裕尔河流域土壤侵蚀模数(a)和坡面与沟道侵蚀量(b)空间分布特征
Fig.5 Spatial distribution characteristics of soil erosion intensity (a) and hillslope and gully soil erosion amount (b) in the Wuyuer River Basin
研究区内坡度范围为0°~56°,利用SPSS 22.0对各坡度及对应的土壤侵蚀模数进行相关性分析,结果表明:该区土壤侵蚀与坡度关系较为密切,相关系数为0.63(P<0.01),说明坡度是影响土壤侵蚀的重要因素。利用ArcGIS 10.2,参考水利部发布的土壤侵蚀分级标准,将坡度分为5级,获取每一级坡度的平均土壤侵蚀模数(表5)。结果表明,流域侵蚀主要来自占流域总面积85%的0°~5°坡面上,且平均土壤侵蚀模数随坡度的增大而增大。这是因为坡度越大,入渗减少,地表径流增加,径流冲刷能力越为剧烈,土壤流失量越大。然而,5°~8°与8°~15°坡面的土壤侵蚀强度却大于15°~25°坡面上的侵蚀强度,这可能与15°~25°坡面中80%的土地利用类型为林地有关。东北黑土区地形特点是坡缓坡长,在0°~5°坡面上,出现较多沉积,而非侵蚀,因此整个0°~5°坡面的平均土壤侵蚀强度仍小于15°~25°坡面的侵蚀强度。
表5 乌裕尔河流域不同坡度的土壤侵蚀特征
Tab.5 Characteristics of soil erosion for different slopes in the Wuyuer River Basin
| 坡度分级/° | 面积 /km2 | 百分比 /% | 侵蚀量 /(104 t/a) | 平均侵蚀模数 /[t/(km2·a)] |
|---|---|---|---|---|
| 0~5 | 6262.12 | 85.01 | 210.40 | 335.98 |
| 5~8 | 748.36 | 10.16 | 56.35 | 752.93 |
| 8~15 | 316.20 | 4.29 | 23.33 | 738.05 |
| 15~25 | 38.04 | 0.52 | 2.28 | 599.76 |
| 25~35 | 1.44 | 0.02 | 0.15 | 1054.17 |
| >35 | 0.28 | / | 0.09 | 3307.14 |
| 合计 | 7366.44 | / | 292.60 | 397.21 |
利用ArcGIS 10.2将乌裕尔河流域土地利用图与土壤侵蚀模数图叠加,得到不同土地利用类型下的土壤侵蚀状况(表6)。结果表明,流域内主要土地利用类型为耕地,占流域总面积的63.86%。不同土地利用类型的侵蚀模数差异较大,其大小关系为:耕地>草地>居民用地>林地>未利用土地>水域。其中流域内耕地的土壤侵蚀模数为556.25 t/(km2·a)。鄂立思(2015)利用RUSLE模型,得到乌裕尔河流域耕地的平均侵蚀模数为594 t/(km2·a);盛美玲等(2015)研究表明,拜泉县齐心水库控制流域0°~3°农田侵蚀模数为592.8 t/(km2·a),与表6计算结果差异较小。进一步将耕地与坡度图叠加,发现耕地主要集中在0°~5°的坡度,该坡度范围是坡耕地土壤侵蚀量的主要来源(表7)。然而,平均土壤侵蚀模数随坡度增大而增大,坡度为15°~25°的耕地土壤侵蚀模数高达2508 t/(km2·a),属中度侵蚀,是流域治理的重点,应加强水土保持措施的实施。
表6 乌裕尔河流域不同土地利用类型的土壤侵蚀特征
Tab.6 Characteristics of soil erosion for different land use types in the Wuyuer River Basin
| 土地利用类型 | 面积/km2 | 百分比/% | 侵蚀量/(104 t/a) | 平均侵蚀模数/[t/(km2·a)] |
|---|---|---|---|---|
| 耕地 | 4704.32 | 63.86 | 261.68 | 556.25 |
| 林地 | 1007.00 | 13.67 | 11.64 | 115.62 |
| 草地 | 352.36 | 4.78 | 8.50 | 241.38 |
| 水域 | 76.56 | 0.7 | 0.34 | 44.41 |
| 城乡、工矿、居民用地 | 271.20 | 3.68 | 5.31 | 195.73 |
| 未利用土地 | 955.00 | 12.96 | 5.13 | 53.75 |
| 总计 | 7366.44 | / | 292.60 | 397.21 |
草地土壤侵蚀模数为241.38 t/(km2·a),次于耕地,略高于居民用地,分布于流域中部的少量草地土壤侵蚀模数甚至高于5000 t/(km2·a)。利用ArcGIS提取坡向后,发现此类草地坡面多向阳,植被覆盖度略低于阴坡,导致土壤侵蚀量增大。简金世(2011)研究表明,依安控制站草地平均侵蚀模数为232.95 t/(km2·a),再次验证了本文结果的合理性。居民用地由于人类活动较为剧烈,对地表造成扰动,也导致了一定的水土流失。
表7 乌裕尔河流域不同坡度耕地的土壤侵蚀特征
Tab.7 Characteristics of soil erosion for arable land of different slopes in the Wuyuer River Basin
| 坡耕地坡度/° | 面积/km2 | 占耕地面积百分比/% | 侵蚀量/104 t | 平均侵蚀模数/(t/(km2·a)) |
|---|---|---|---|---|
| 0~5 | 4207.80 | 89.52 | 191.68 | 455.54 |
| 5~8 | 401.72 | 8.55 | 50.09 | 1247.00 |
| 8~15 | 87.80 | 1.97 | 18.31 | 2085.52 |
| 15~24 | 3.00 | 0.06 | 0.75 | 2508.67 |
林地土壤侵蚀模数较低,为115.62 t/(km2·a),说明林地水土保持功能较好,具削减降雨冲刷力、调节地表径流、控制水土流失的作用。王志杰等(2013)利用RUSLE模型得到松花江流域漫川漫岗区农新站控制流域林地土壤侵蚀模数为145.94 t/(km2·a),可与本文结果进行参考。但本文研究区林地的土壤侵蚀模数相较东北地区其他研究(张素梅等, 2008; 李雪莹等, 2015)仍有些偏大,这可能是因为部分林地分布在坡度较大的地方,甚至有相当数量的疏林地集中在坡度大于15°的区域。于书霞等(2001)在东北松花湖流域,基于GIS与USLE模型发现,分布在坡度0°~7.5°的林地,土壤侵蚀模数可达155.82 t/(km2·a);坡度大于17.5°时,甚至可达1619.66 t/(km2·a)。可见,林地的水土保持功能也受地形条件的制约。
模型计算水域仍有部分土壤侵蚀量,这是因为土地利用图中,水域由面状湖泊/塘坝和线状沟道组成,面状水域侵蚀强度为0,线状侵蚀强度较大。子流域尺度上沟道侵蚀可占较大比例(Fang, 2015)。因而,水域总侵蚀强度为44.41 t/(km2·a)。总的来看,乌裕尔河流域各土地利用类型中,耕地对应的土壤侵蚀模数最大,尤其是坡度较大的耕地,应作为土壤侵蚀治理的重点。同时,植被覆盖度较低的区域,也应加强水土保持林草措施的推广,降低土壤侵蚀强度。
本文以乌裕尔河流域为研究对象,利用TETIS模型对1971-1987年实测日径流与泥沙数据进行了率定和验证,成功模拟了流域产流产沙特征,得到以下结论:
(1) TETIS模型在乌裕尔河流域适用性较高,能较好地模拟径流、侵蚀与产沙,与该区其他模型相比,精度更高。
(2) 乌裕尔河流域的平均侵蚀模数为397.2 t/(km2·a),大于东北黑土区允许土壤流失量200 t/(km2·a),主要表现为微度与轻度侵蚀,侵蚀类型以面蚀为主。
(3) 流域内土壤侵蚀与坡度关系密切,土壤侵蚀模数基本上随坡度的增大而增大,0°~5°坡度是流域内侵蚀量的主要来源。
(4) 不同土地类型土壤侵蚀模数大小顺序为:耕地>草地>居民用地>林地>未利用土地>水域。应将坡度较大的耕地和植被覆盖度较低的区域作为流域土壤侵蚀治理的重点。
本文将TETIS模型应用于东北黑土区的大尺度流域(>2000 km2),模型总体模拟效果令人满意,但模型也存在一些不足。一方面,模型集成的地形土壤文件提高了模型校正过程的效率,但针对大尺度流域,需要适当降低DEM分辨率,才能使模型计算时间在可接受范围内。降低DEM分辨率的过程可能使部分地形信息丢失,导致使沟道估计的误差增大等。因此,如要更好地区分坡面/沟道侵蚀,TETIS模型可能更适用于具有典型沟蚀特征的中小尺度 (<2000 km2,甚至<100 km2)流域;针对大尺度流域,TETIS模型在整体上模拟效果好,但可能不能完全准确地反映坡沟侵蚀关系,且需要在DEM分辨率和模型运算时间之间找到平衡点。另一方面,模型根据集水面积临界值划分坡面和沟道,但沟道形成还与坡度有关,这一点在未来模型版本中也应有待改进。本文初步探讨了TETIS模型在黑土区的应用,既可为揭示黑土区土壤侵蚀机理提供参考,也可为该模型在黑土区其他流域的应用提供依据,并为水土保持治理及效益评价提供模型工具。
The authors have declared that no competing interests exist.
| [1] |
RUSLE侵蚀模型的应用及进展 [J].
RUSLE模型是在美国通用土壤流失模型USLE的基础上建立起来的,是目前国内外应用广泛的土壤侵蚀预测模型之一.从RUSLE模型开发背景,RUSLE模型的主要修订内容,模型的实施与进展,RUSLE2模型介绍,RUSLE模型的局限性及RUSLE模型的应用前景等6个方面对模型的应用及研究进展进行了综合性评述,为我国土壤侵蚀模型的建立提供参考.
Proceeding and application on soil erosion model of RUSLE [J].
RUSLE模型是在美国通用土壤流失模型USLE的基础上建立起来的,是目前国内外应用广泛的土壤侵蚀预测模型之一.从RUSLE模型开发背景,RUSLE模型的主要修订内容,模型的实施与进展,RUSLE2模型介绍,RUSLE模型的局限性及RUSLE模型的应用前景等6个方面对模型的应用及研究进展进行了综合性评述,为我国土壤侵蚀模型的建立提供参考.
|
| [2] |
东北典型黑土区气候、地貌演化与黑土发育关系 [J].https://doi.org/10.3321/j.issn:1000-0585.2008.03.006 URL Magsci [本文引用: 1] 摘要
<p>通过野外实地调查,利用地层学方法结合孢粉分析结果,研究了黑土区地层地貌的发育历史、地层序列以及古气候变化,重建黑土、黑钙土的发育历史及发育所需的地貌、气候条件。结果表明,黑土从温暖湿润的晚更新世早期便开始在嫩江的二、三级阶地上发育,而黑钙土则从全新世初开始在嫩江的一级阶地上发育,这时气候处于暖干期,且一级阶地地势较低,水位相对较高,容易接受上方高地淋洗下来的钙,从而在土壤中形成比较典型的淀积层。可见,地貌条件及气候因素对黑土、黑钙土的形成发育起到至关重要的作用。研究结果为黑土区的水土保持及土壤改良研究提供理论基础,同时为正确评估黑土层的侵蚀速率及制订合理的改良措施提供科学的参考。</p>
Relationship between black soil development and climate change and geomorphological evolution in Northeast China [J].https://doi.org/10.3321/j.issn:1000-0585.2008.03.006 URL Magsci [本文引用: 1] 摘要
<p>通过野外实地调查,利用地层学方法结合孢粉分析结果,研究了黑土区地层地貌的发育历史、地层序列以及古气候变化,重建黑土、黑钙土的发育历史及发育所需的地貌、气候条件。结果表明,黑土从温暖湿润的晚更新世早期便开始在嫩江的二、三级阶地上发育,而黑钙土则从全新世初开始在嫩江的一级阶地上发育,这时气候处于暖干期,且一级阶地地势较低,水位相对较高,容易接受上方高地淋洗下来的钙,从而在土壤中形成比较典型的淀积层。可见,地貌条件及气候因素对黑土、黑钙土的形成发育起到至关重要的作用。研究结果为黑土区的水土保持及土壤改良研究提供理论基础,同时为正确评估黑土层的侵蚀速率及制订合理的改良措施提供科学的参考。</p>
|
| [3] |
乌裕尔河流域土壤侵蚀时空分布特征及影响因素研究[D] . |
| [4] |
基于GIS和RUSLE乌裕尔河流域土壤侵蚀定量评价 [J].https://doi.org/10.3969/j.issn.1000-5617.2015.02.042 URL 摘要
基于修正的通用土壤流失方程(RUSLE)和GIS技术,以位于东北黑土耕作区的乌裕尔河流域为研究区,以遥感影像为数据源,结合自然地理环境特征,提取土壤侵蚀模型的各种因子,估算土壤侵蚀模数.根据SL190-96的分级标准,对土壤侵蚀强度进行了分级,获得乌裕尔河流域土壤侵蚀现状图,并对不同土地利用类型的土壤侵蚀状况进行了统计,结果表明:乌裕尔河流域土壤侵蚀以轻度侵蚀为主,共有8116.16 km2,占65.05%,其中轻Ⅰ型面积为4068.62 km2,占32.6%,中度侵蚀面积为1394.82 km2,占11.2%;轻度侵蚀集中连片分布,而中度以上侵蚀主要集中在坡度较大区域.土地利用类型中以旱田侵蚀最突出,主要表现为大面积的轻度侵蚀强度;但未利用地侵蚀最严重,主要体现在中度以上侵蚀;林地、草地和居民地以微度侵蚀和轻度侵蚀为主;0~3°、3~8°以下以轻度侵蚀为主,强度侵蚀和极强侵蚀,在坡度为8~15°时达到最大侵蚀面积.
|
| [5] |
东北典型黑土区乌裕尔河中游泥沙输移月年时间尺度特征 [J].https://doi.org/10.3321/j.issn:0468-155X.2009.02.003 URL [本文引用: 1] 摘要
水土流失是土壤侵蚀、泥沙输移和沉积的统一体.东北黑土区有关河 流泥沙输移时间尺度的研究有助于更好的揭示黑土区土壤侵蚀规律和泥沙运移机制.本文以典型黑土区乌裕尔河中游依安水文站为研究对象,利用该站 1957-1989年33年月、年时间尺度上的水沙数据,对黑土区河流泥沙输移特征进行了分析.研究认为,在月时间尺度上,水沙关系松散,径流量对泥沙量 的决定系数为53.8%;年内月泥沙量存在着两个峰值,分别发生在春季的5月份和夏季的7月份,流域泥沙存在"存储-释放"的过程.流域泥沙量年际尺度差 异大,受人类活动的影响,1957年以来,泥沙量和径流产沙能力呈现逐年增加的趋势.
Sediment transport characteristics at the monthly and yearly scales in midstream of Wuyuer River in the typical black soil region of Northeastern China [J].https://doi.org/10.3321/j.issn:0468-155X.2009.02.003 URL [本文引用: 1] 摘要
水土流失是土壤侵蚀、泥沙输移和沉积的统一体.东北黑土区有关河 流泥沙输移时间尺度的研究有助于更好的揭示黑土区土壤侵蚀规律和泥沙运移机制.本文以典型黑土区乌裕尔河中游依安水文站为研究对象,利用该站 1957-1989年33年月、年时间尺度上的水沙数据,对黑土区河流泥沙输移特征进行了分析.研究认为,在月时间尺度上,水沙关系松散,径流量对泥沙量 的决定系数为53.8%;年内月泥沙量存在着两个峰值,分别发生在春季的5月份和夏季的7月份,流域泥沙存在"存储-释放"的过程.流域泥沙量年际尺度差 异大,受人类活动的影响,1957年以来,泥沙量和径流产沙能力呈现逐年增加的趋势.
|
| [6] |
松花江流域不同空间尺度典型流域泥沙输移比及其影响因素 [J].Sediment delivery ratios of typical watersheds on different spatial scales in Songhua River basin and its affecting factors [J]. |
| [7] |
DEM数据源及分辨率对HEC-HMS水文模拟的影响 [J].https://doi.org/10.14042/j.cnki.32.1309.2015.05.003 URL [本文引用: 1] 摘要
DEM数据源及分辨率会影响流域特征参数的提取, 进而影响水文模拟结果. 将 ASTER 30 m DEM、SRTM 90 m DEM及基于ASTER 30 m DEM的40 m、 50 m、 60 m、 70 m、 80 m、 90 m重采样DEM作为HEC-geoHMS模型输入, 提取流域特征, 采用HEC-HMS模型, 以西笤溪流域为研究区域, 分析2011年6月和2011年8—9月的两场降雨径流过程中, DEM数据源和分辨率对水文模拟输出的影响. 研究结果表明, 两次径流模拟结果与实测数据拟合都较好, 模型确定性系数都大于0. 82, 但是单峰的洪水模拟效果总体更好, 基于SRTM 90 m的模型确定性系数比基于ASTER 30 m DEM、 重采样90 m DEM的模型确定性系数都大. 基于重采样DEM的模型确定性系数变化较大, 而且与分辨率的变化呈非线性关系. 在HEC-HMS的模拟中, 基于ASTER 30 m DEM和基于SRTM 90 m DEM的模拟输出结果相对误差相差3%~5%, 基于SRTM 90 m DEM和基于重采样90 m DEM的模拟输出结果相对误差相差2%~4%, 基于重采样DEM的模拟输出结果相对误差相差最大达到了11%.
Effects of DEM source and resolution on the HEC-HMS hydrological simulation [J].https://doi.org/10.14042/j.cnki.32.1309.2015.05.003 URL [本文引用: 1] 摘要
DEM数据源及分辨率会影响流域特征参数的提取, 进而影响水文模拟结果. 将 ASTER 30 m DEM、SRTM 90 m DEM及基于ASTER 30 m DEM的40 m、 50 m、 60 m、 70 m、 80 m、 90 m重采样DEM作为HEC-geoHMS模型输入, 提取流域特征, 采用HEC-HMS模型, 以西笤溪流域为研究区域, 分析2011年6月和2011年8—9月的两场降雨径流过程中, DEM数据源和分辨率对水文模拟输出的影响. 研究结果表明, 两次径流模拟结果与实测数据拟合都较好, 模型确定性系数都大于0. 82, 但是单峰的洪水模拟效果总体更好, 基于SRTM 90 m的模型确定性系数比基于ASTER 30 m DEM、 重采样90 m DEM的模型确定性系数都大. 基于重采样DEM的模型确定性系数变化较大, 而且与分辨率的变化呈非线性关系. 在HEC-HMS的模拟中, 基于ASTER 30 m DEM和基于SRTM 90 m DEM的模拟输出结果相对误差相差3%~5%, 基于SRTM 90 m DEM和基于重采样90 m DEM的模拟输出结果相对误差相差2%~4%, 基于重采样DEM的模拟输出结果相对误差相差最大达到了11%.
|
| [8] |
黑土区基准坡长和LS算法对地形因子的影响 [J].https://doi.org/10.3969/j.issn.1002-6819.2015.03.023 URL Magsci [本文引用: 1] 摘要
该文结合小区实测坡长资料及McCool数据,对地形因子算法中涉及的基准坡长影响和不同算法计算值的特征进行了讨论。研究表明,在坡长较小的情况下,20和22.13 m基准坡长计算得到的坡长因子相差不大,但随着坡度增加,在坡长指数的复合影响下,两者的差异渐趋增大。理论分析表明,坡长指数采用与坡度相关的变值更为合理。通过与实测数据对比发现,修正版通用土壤侵蚀模型(RUSLE)算法中的坡长因子与其更为接近,结合与McCool数据的对比分析表明,研究区坡长指数更适合细沟和细沟间侵蚀比率中等的情形,或者采用RUSLE模型算法计算得到。同时研究发现,张宪奎算法、Moore算法、Desmet算法和B?hner算法计算得到的LS因子值都要比参照值小,而且4种算法与参照值的接近程度依次降低。空间分布特征而言,栅格累计算法总体较为破碎,并在平直坡面出现较多平行分布条带,而含有面积指标的其他3种算法则总体呈现光滑连续特性,但有无数据区域的存在。该结果对于研究区土壤侵蚀模型地形因子算法选择具有一定的现实意义。
Effects of both slope length of standard plot and algorithms of LS on calculated values of topography factor (LS) in black soil areas in Northeast China [J].https://doi.org/10.3969/j.issn.1002-6819.2015.03.023 URL Magsci [本文引用: 1] 摘要
该文结合小区实测坡长资料及McCool数据,对地形因子算法中涉及的基准坡长影响和不同算法计算值的特征进行了讨论。研究表明,在坡长较小的情况下,20和22.13 m基准坡长计算得到的坡长因子相差不大,但随着坡度增加,在坡长指数的复合影响下,两者的差异渐趋增大。理论分析表明,坡长指数采用与坡度相关的变值更为合理。通过与实测数据对比发现,修正版通用土壤侵蚀模型(RUSLE)算法中的坡长因子与其更为接近,结合与McCool数据的对比分析表明,研究区坡长指数更适合细沟和细沟间侵蚀比率中等的情形,或者采用RUSLE模型算法计算得到。同时研究发现,张宪奎算法、Moore算法、Desmet算法和B?hner算法计算得到的LS因子值都要比参照值小,而且4种算法与参照值的接近程度依次降低。空间分布特征而言,栅格累计算法总体较为破碎,并在平直坡面出现较多平行分布条带,而含有面积指标的其他3种算法则总体呈现光滑连续特性,但有无数据区域的存在。该结果对于研究区土壤侵蚀模型地形因子算法选择具有一定的现实意义。
|
| [9] |
东北漫川漫岗黑土区浅沟和切沟发生的地貌临界模型探讨 [J].https://doi.org/10.3969/j.issn.1000-0690.2006.04.011 URL [本文引用: 1] 摘要
The theory of geomorphic threshold has been widely applied in study of predicting the area of ephemeral gully incision. Based on the measurement in field and relief map, this paper got the coefficient () and () in threshold model =-b (where is local slope, is upslope drainage area), and verified whether the gully incision formula used by Moore is suitable in study area. The analysis showed that the threshold value () and exponent coefficient () are 0.1161 and -0.4457 respectively for gully, 0.0631 and -0.4643 respectively for ephemeral gully; and that gully incision formula used by Moore is not suitable in study area. Compared with the distribution of ephemeral gully in field, it is found that the prone area predicted by threshold model is fairly well consistent with the actual ephemeral gully distribution. Meanwhile, it was found that the bigger the value in threshold model, the more unsusceptible the prone area to the change of threshold value, vice versa, which is approved by the prone area of gully incision. These provide primary design guidance for local soil and water conservation.
Geomorphic threshold model for ephemeral gully incision in rolling hills with black soil in Northeast China [J].https://doi.org/10.3969/j.issn.1000-0690.2006.04.011 URL [本文引用: 1] 摘要
The theory of geomorphic threshold has been widely applied in study of predicting the area of ephemeral gully incision. Based on the measurement in field and relief map, this paper got the coefficient () and () in threshold model =-b (where is local slope, is upslope drainage area), and verified whether the gully incision formula used by Moore is suitable in study area. The analysis showed that the threshold value () and exponent coefficient () are 0.1161 and -0.4457 respectively for gully, 0.0631 and -0.4643 respectively for ephemeral gully; and that gully incision formula used by Moore is not suitable in study area. Compared with the distribution of ephemeral gully in field, it is found that the prone area predicted by threshold model is fairly well consistent with the actual ephemeral gully distribution. Meanwhile, it was found that the bigger the value in threshold model, the more unsusceptible the prone area to the change of threshold value, vice versa, which is approved by the prone area of gully incision. These provide primary design guidance for local soil and water conservation.
|
| [10] |
松花江流域不同侵蚀类型区泥沙输移比的估算[D] .
|
| [11] |
|
| [12] |
基于USLE模型的吉林梨树县土壤侵蚀现状初步分析[D] . |
| [13] |
黑土区典型小流域水土流失演变与输移特征研究[D] . |
| [14] |
基于RUSLE模型的土壤侵蚀量估算: 以辽宁省阜新市为例 [J].
[目的]准确掌握辽宁省阜新市的土壤侵蚀状况,为政府制定土地和经济方面的相关政策提供科学依据.[方法]基于修正的土壤流失方程(RUSLE),运用RS和GIS等技术和方法,对阜新市的土壤侵蚀状况进行分析和研究.[结果]阜新市年均土壤侵蚀量为1.99×10⁷ t,土壤侵蚀模数为19.18 t/(hm2·a).土壤侵蚀强度在中度以下的区域占研究区总面积的77.01%,对研究区土壤侵蚀量的贡献率为12.57%,而中度以上侵蚀区域占研究区总面积的22.99%,对研究区土壤侵蚀量的贡献率高达87.43%.[结论]5.~25°为研究区主要侵蚀坡度段,裸土地、湖泊和农村居民点为研究区主要侵蚀地带,应将其列为水土保持重点治理对象.
Estimation of soil erosion amount based on RUSLE model: A case study in Fuxin City of Liaoning Province [J].
[目的]准确掌握辽宁省阜新市的土壤侵蚀状况,为政府制定土地和经济方面的相关政策提供科学依据.[方法]基于修正的土壤流失方程(RUSLE),运用RS和GIS等技术和方法,对阜新市的土壤侵蚀状况进行分析和研究.[结果]阜新市年均土壤侵蚀量为1.99×10⁷ t,土壤侵蚀模数为19.18 t/(hm2·a).土壤侵蚀强度在中度以下的区域占研究区总面积的77.01%,对研究区土壤侵蚀量的贡献率为12.57%,而中度以上侵蚀区域占研究区总面积的22.99%,对研究区土壤侵蚀量的贡献率高达87.43%.[结论]5.~25°为研究区主要侵蚀坡度段,裸土地、湖泊和农村居民点为研究区主要侵蚀地带,应将其列为水土保持重点治理对象.
|
| [15] |
WEPP模型(坡面版)在东北黑土区的适用性评价[D] . |
| [16] |
1957-2009年中国台站观测的关键积雪参数时空变化特征 [J].
利用1957-2009年中国地面气象台站观测积雪资料分析表明, 中国年平均雪深、雪水当量、积雪密度分别为0.49 cm、0.7 mm、0.14 g·cm<sup>-3</sup>. 平均来说, 三者在青藏高原地区都是最小的, 在西北地区均较大; 空间上, 中国年平均雪深和雪水当量大值区位于东北和新疆北部, 以及青藏高原西南部的小部分区域; 中国大部分地区年平均积雪密度在0.14 g·cm<sup>-3</sup>以下, 3大稳定积雪区积雪密度略高. 1957-2009年, 中国及各区域年平均雪深和雪水当量均表现为波动增加趋势, 但不显著; 空间上雪深的显著正趋势主要位于内蒙古东部、东北北部、新疆西北部和青藏高原东北部; 雪水当量与雪深类似, 但正趋势范围不如前者广, 负趋势范围则较大.
Spatial-temporal characteristics of observed key parameters for snow cover in China during 1957-2009 [J].
利用1957-2009年中国地面气象台站观测积雪资料分析表明, 中国年平均雪深、雪水当量、积雪密度分别为0.49 cm、0.7 mm、0.14 g·cm<sup>-3</sup>. 平均来说, 三者在青藏高原地区都是最小的, 在西北地区均较大; 空间上, 中国年平均雪深和雪水当量大值区位于东北和新疆北部, 以及青藏高原西南部的小部分区域; 中国大部分地区年平均积雪密度在0.14 g·cm<sup>-3</sup>以下, 3大稳定积雪区积雪密度略高. 1957-2009年, 中国及各区域年平均雪深和雪水当量均表现为波动增加趋势, 但不显著; 空间上雪深的显著正趋势主要位于内蒙古东部、东北北部、新疆西北部和青藏高原东北部; 雪水当量与雪深类似, 但正趋势范围不如前者广, 负趋势范围则较大.
|
| [17] |
基于GIS技术的古城小流域土壤侵蚀研究 [J].GIS-based research of soil erosion in Gucheng small watershed [J]. |
| [18] |
WaTEM/SEDEM模型及其应用研究进展与展望 [J].https://doi.org/10.11820/dlkxjz.2014.01.010 URL Magsci [本文引用: 2] 摘要
土壤侵蚀产沙模型是开展水土保持研究的重要工具。土壤侵蚀物理模型除能够模拟和预测土壤侵蚀沉积的空间分布外,其可移植性功能较强,因此得到了很多研究者的青睐,但大多数物理模型运行时需要的参数较多,因而限制了模型应用和推广。本文介绍了比利时鲁汶大学研发的分布式土壤侵蚀模型WaTEM/SEDEM(Waterand Tillage Erosion Model and Sediment Delivery Model)模型,分别从WaTEM/SEDEM 模型的产生、结构、国内外应用进行了系统阐述,并在已有的应用研究基础上,总结了该模型的优缺点,展望其应用前景。
Research progress in WaTEM/SEDEM model and its application prospect [J].https://doi.org/10.11820/dlkxjz.2014.01.010 URL Magsci [本文引用: 2] 摘要
土壤侵蚀产沙模型是开展水土保持研究的重要工具。土壤侵蚀物理模型除能够模拟和预测土壤侵蚀沉积的空间分布外,其可移植性功能较强,因此得到了很多研究者的青睐,但大多数物理模型运行时需要的参数较多,因而限制了模型应用和推广。本文介绍了比利时鲁汶大学研发的分布式土壤侵蚀模型WaTEM/SEDEM(Waterand Tillage Erosion Model and Sediment Delivery Model)模型,分别从WaTEM/SEDEM 模型的产生、结构、国内外应用进行了系统阐述,并在已有的应用研究基础上,总结了该模型的优缺点,展望其应用前景。
|
| [19] |
东北黑土区小流域侵蚀产沙WaTEM/SEDEM模型模拟 [J].
The black soil region of Northeast China is one of the most important grain bases in China. In recent years,severe soil erosion in this region has been a threat to agricultural production. Soil and sediment transport models are important tools that predict soil erosion and sediment yield under different conditions. However,other models are rarely used except for the RUSLE and slope version WEPP models in the black soil region of Northeast China. The Water and Tillage Erosion Model and Sediment Delivery Model (WaTEM/SEDEM) was developed as a spatially distributed soil erosion and sediment delivery model and is similar to the (R)USLE model. It can spatially model soil erosion and sediment deposition rates and soil redistribution patterns. In this study,the WaTEM/SEDEM model was applied to 25 dam-controlled catchments in Baiquan county in the black soil region. Transport capacity coefficients (K) in the model were first calibrated using sediment yield data of 14 dam-controlled catchments and validated using the remaining 11 dam-controlled catchments. Therefore the optimal K-values of the WaTEM/SEDEM model were 0.38 and 0.55. The correlation coefficient values of sediment yield(SY) and area specific sediment yield (SSY) between observed and predicted values were 0.95 and 0.34,respectively. The simulated results of sediment yield using the WaTEM/SEDEM model were good and the simulated mean sediment delivery ratio (SDR) for the 25 dam-controlled catchments was 0.32. Finally,the calibrated WaTEM/SEDEM was applied to the Qixin dam-controlled catchment. Simulated results showed that the mean soil erosion rate is 351.2t/(km·a). Erosion rates vary with land use types and slops. Comparison of this study to published results demonstrates that WaTEM/SEDEM gives satisfactory result for the study region. This study provides a basis for the implementation of erosion control measurements in the black soil region,Northeast China.
Modeling soil erosion and sediment yield using WaTEM/SEDEM model for the black soil region of Northeast China [J].
The black soil region of Northeast China is one of the most important grain bases in China. In recent years,severe soil erosion in this region has been a threat to agricultural production. Soil and sediment transport models are important tools that predict soil erosion and sediment yield under different conditions. However,other models are rarely used except for the RUSLE and slope version WEPP models in the black soil region of Northeast China. The Water and Tillage Erosion Model and Sediment Delivery Model (WaTEM/SEDEM) was developed as a spatially distributed soil erosion and sediment delivery model and is similar to the (R)USLE model. It can spatially model soil erosion and sediment deposition rates and soil redistribution patterns. In this study,the WaTEM/SEDEM model was applied to 25 dam-controlled catchments in Baiquan county in the black soil region. Transport capacity coefficients (K) in the model were first calibrated using sediment yield data of 14 dam-controlled catchments and validated using the remaining 11 dam-controlled catchments. Therefore the optimal K-values of the WaTEM/SEDEM model were 0.38 and 0.55. The correlation coefficient values of sediment yield(SY) and area specific sediment yield (SSY) between observed and predicted values were 0.95 and 0.34,respectively. The simulated results of sediment yield using the WaTEM/SEDEM model were good and the simulated mean sediment delivery ratio (SDR) for the 25 dam-controlled catchments was 0.32. Finally,the calibrated WaTEM/SEDEM was applied to the Qixin dam-controlled catchment. Simulated results showed that the mean soil erosion rate is 351.2t/(km·a). Erosion rates vary with land use types and slops. Comparison of this study to published results demonstrates that WaTEM/SEDEM gives satisfactory result for the study region. This study provides a basis for the implementation of erosion control measurements in the black soil region,Northeast China.
|
| [20] |
气候变化及人类活动对流域水资源的影响及实例研究[D] .
|
| [21] |
辽河重污染支流招苏台河径流和泥沙模拟研究 [J].URL 摘要
在3S技术和基础信息数据库的支撑下,应用SWAT模型对招苏台河流域径流和泥沙进行了模拟研究,利用2004-2009年的日径流量、输沙率等水文实测数据对模型进行校准和验证,评价参数满足要求.模拟结果表明:研究区年平均径流量和输沙量为1.64m3/s、6.90万t,土壤侵蚀模数为62.93 t/(km2·a),侵蚀强度为微度侵蚀,耕地的土壤侵蚀模数最大,是该河泥沙的主要来源;径流量和输沙量在时间分布上具有季节性特点;根据研究区的水土流失特征,提出拟采取的水土保持措施,并模拟了河流两岸不同尺度植被缓冲带控制情景条件下的水文响应.该研究揭示了招苏台河流域径流和泥沙产生的规律和特征,为研究区水土保持和重污染河流的治理提供数据和管理决策支持.
The simulation of runoff and sediment in heavy polluted tributary in Liaohe-Zhaosutai River [J].URL 摘要
在3S技术和基础信息数据库的支撑下,应用SWAT模型对招苏台河流域径流和泥沙进行了模拟研究,利用2004-2009年的日径流量、输沙率等水文实测数据对模型进行校准和验证,评价参数满足要求.模拟结果表明:研究区年平均径流量和输沙量为1.64m3/s、6.90万t,土壤侵蚀模数为62.93 t/(km2·a),侵蚀强度为微度侵蚀,耕地的土壤侵蚀模数最大,是该河泥沙的主要来源;径流量和输沙量在时间分布上具有季节性特点;根据研究区的水土流失特征,提出拟采取的水土保持措施,并模拟了河流两岸不同尺度植被缓冲带控制情景条件下的水文响应.该研究揭示了招苏台河流域径流和泥沙产生的规律和特征,为研究区水土保持和重污染河流的治理提供数据和管理决策支持.
|
| [22] |
|
| [23] |
东北典型黑土区坡沟侵蚀耦合关系 [J].Coupling mechanism of slope-gully erosion in typical black soil area of Northeast China [J]. |
| [24] |
基于RUSLE的松花江流域不同侵蚀类型区泥沙输移比估算 [J].URL 摘要
为摸清东北黑土区土壤侵蚀与泥沙输移特征,以松花江流域为研究对 象,选取不同侵蚀类型区8个水文站控制区,利用RUSLE模型,结合水文站实测输沙数据,分析了不同侵蚀类型区泥沙输移比的时空变化特征.结果表明: (1)松花江流域各侵蚀类型区均以微度侵蚀和轻度侵蚀为主,而草地、旱地和裸地侵蚀模数均呈现依次增大趋势,且大于该区容许土壤流失量,特别是松岭站、碾 子山站、大石寨站和大山咀子站水文站控制区裸地土壤侵蚀模数均大于20 000 t/(km2·a),达到剧烈侵蚀程度.不同侵蚀类型区之间侵蚀模数表现为丘陵沟壑区Ⅰ>丘陵沟壑区Ⅱ>天然林区>漫川漫岗区.(2)松花江流域不同侵蚀 类型区泥沙输移比总体上表现为漫川漫岗区>丘陵沟壑区Ⅱ>丘陵沟壑区Ⅰ>天然林区.(3)同一侵蚀类型区不同年际间泥沙输移比波动起伏,而从20世纪60 年代到80年代,人类活动影响较小的天然林区和丘陵沟壑区Ⅱ不同时期平均泥沙输移比相差不大,人类活动剧烈的漫川漫岗区和丘陵沟壑区Ⅰ平均泥沙输移比则表 现为波动式递增.研究结果对于了解东北黑土区土壤侵蚀和泥沙输移规律,明确该区域土壤侵蚀机理和治理目标具有指导意义.
Estimation of sediment delivery ratio in different soil erosion regions in the Songhua River basin based on RUSLE [J].URL 摘要
为摸清东北黑土区土壤侵蚀与泥沙输移特征,以松花江流域为研究对 象,选取不同侵蚀类型区8个水文站控制区,利用RUSLE模型,结合水文站实测输沙数据,分析了不同侵蚀类型区泥沙输移比的时空变化特征.结果表明: (1)松花江流域各侵蚀类型区均以微度侵蚀和轻度侵蚀为主,而草地、旱地和裸地侵蚀模数均呈现依次增大趋势,且大于该区容许土壤流失量,特别是松岭站、碾 子山站、大石寨站和大山咀子站水文站控制区裸地土壤侵蚀模数均大于20 000 t/(km2·a),达到剧烈侵蚀程度.不同侵蚀类型区之间侵蚀模数表现为丘陵沟壑区Ⅰ>丘陵沟壑区Ⅱ>天然林区>漫川漫岗区.(2)松花江流域不同侵蚀 类型区泥沙输移比总体上表现为漫川漫岗区>丘陵沟壑区Ⅱ>丘陵沟壑区Ⅰ>天然林区.(3)同一侵蚀类型区不同年际间泥沙输移比波动起伏,而从20世纪60 年代到80年代,人类活动影响较小的天然林区和丘陵沟壑区Ⅱ不同时期平均泥沙输移比相差不大,人类活动剧烈的漫川漫岗区和丘陵沟壑区Ⅰ平均泥沙输移比则表 现为波动式递增.研究结果对于了解东北黑土区土壤侵蚀和泥沙输移规律,明确该区域土壤侵蚀机理和治理目标具有指导意义.
|
| [25] |
东北黑土区小流域农业景观结构与土壤侵蚀的关系 [J].https://doi.org/10.3321/j.issn:1000-0933.2006.08.025 URL [本文引用: 1] 摘要
以黑土侵蚀区的拜泉县双阳河流域为案例,提取地形和土壤类型相对接近的30个上游子流域作为分析样本.以 遥感、GIS和FRAGSTATS软件为平台获得景观格局指数,运用基于GIS的RUSLE模拟土壤侵蚀,通过相关性分析和多元回归研究景观指数与侵蚀模 数的呼应关系.从而探讨土地利用调整和流域综合治理下的景观结构特征对土壤侵蚀的影响,为当地或同类地区土地利用规划和侵蚀治理提供科学参考.结果表明: 顺坡垄农田面积百分比、景观聚集度与土壤侵蚀模数显著正相关,灌木林地、草地面积百分比、香农多样性指数与土壤侵蚀模数显著负相关.9个结构因子与土壤侵 蚀模数的复相关系数(R=0.931)大于单因子相关系数,多个景观结构因子综合地影响了土壤侵蚀,且达到高度相关.研究区侵蚀强度较轻,但大于东北黑土 区土壤容许流失量标准.农田是土壤水蚀的主要景观要素,同时也是水土保持的主战场.增加灌草地斑块、实施农田保护性耕作等将是该流域继续控制土壤侵蚀的有 效办法之一.
Relationship between landscape pattern and soil erosion of an agricultural watershed in the mollisols region of Northeastern China [J].https://doi.org/10.3321/j.issn:1000-0933.2006.08.025 URL [本文引用: 1] 摘要
以黑土侵蚀区的拜泉县双阳河流域为案例,提取地形和土壤类型相对接近的30个上游子流域作为分析样本.以 遥感、GIS和FRAGSTATS软件为平台获得景观格局指数,运用基于GIS的RUSLE模拟土壤侵蚀,通过相关性分析和多元回归研究景观指数与侵蚀模 数的呼应关系.从而探讨土地利用调整和流域综合治理下的景观结构特征对土壤侵蚀的影响,为当地或同类地区土地利用规划和侵蚀治理提供科学参考.结果表明: 顺坡垄农田面积百分比、景观聚集度与土壤侵蚀模数显著正相关,灌木林地、草地面积百分比、香农多样性指数与土壤侵蚀模数显著负相关.9个结构因子与土壤侵 蚀模数的复相关系数(R=0.931)大于单因子相关系数,多个景观结构因子综合地影响了土壤侵蚀,且达到高度相关.研究区侵蚀强度较轻,但大于东北黑土 区土壤容许流失量标准.农田是土壤水蚀的主要景观要素,同时也是水土保持的主战场.增加灌草地斑块、实施农田保护性耕作等将是该流域继续控制土壤侵蚀的有 效办法之一.
|
| [26] |
水土流失对黑土坡耕地土壤有机碳的影响[D] . |
| [27] |
|
| [28] |
基于地理信息系统的土壤侵蚀研究 [J].https://doi.org/10.3969/j.issn.1000-288X.2001.03.006 URL 摘要
在非点源污染研究过程中,土壤流失量的计算是一个重要环节。结合地理信息系统和通用土壤流失方程,选择地形、植被、降雨量等因子,对松花湖流域常山地区土壤流失量进行了估算,并讨论了地形、植被等因子在土壤侵蚀中的影响,提出了相应的控制措施。
Applications of GIS in soil erosion research [J].https://doi.org/10.3969/j.issn.1000-288X.2001.03.006 URL 摘要
在非点源污染研究过程中,土壤流失量的计算是一个重要环节。结合地理信息系统和通用土壤流失方程,选择地形、植被、降雨量等因子,对松花湖流域常山地区土壤流失量进行了估算,并讨论了地形、植被等因子在土壤侵蚀中的影响,提出了相应的控制措施。
|
| [29] |
东北地区流域径流对气候变化与人类活动的响应特征研究[D] .
|
| [30] |
辉发河流域景观格局与土壤侵蚀的关系研究 [J].https://doi.org/10.3321/j.issn:1009-2242.2008.03.007 URL [本文引用: 1] 摘要
为分析景观格局对流域土壤侵蚀的影响,本文应用基于GIS的修订通用土壤流失方程(RUSLE),计算了吉林省中低山水蚀区辉发河流域的土壤侵蚀量。选择聚集度、Shannon多样性等6个景观指数,在RS、GIS和Fragstats软件平台下得到两个尺度的土地利用数据和二级土地利用类型的景观指数数据。以流域内29个子流域为样本,用SPSS软件计算侵蚀模数和景观指数的相关性。把29个子流域分为低强度侵蚀区和高强度侵蚀区,分别探讨景观格局对低、高强度侵蚀区土壤侵蚀的影响。结果表明:(1)辉发河流域的土壤侵蚀主要为微度侵蚀和轻度侵蚀,占流域总面积的90.27%。流域平均侵蚀模数为13.89 t/hm~2·a.为轻度侵蚀,但远超过土壤容许流失量。(2)在各种植被类型区中,草地的侵蚀较为强烈,平均侵蚀模数为31.28 t/hm~2·a,高出流域平均侵蚀模数125%,侵蚀贡献水平达到1.74.成为辉发河流域土壤侵蚀的风险区。(3)6个景观指数与侵蚀模数间均存在显著的相关性,除斑块密度外,均与土壤侵蚀模数高度相关。其中聚集度与侵蚀模数的相关性最大,相关系数为—0.602,聚集度和侵蚀模数间有较强的非线性关系。(4)研究区低、高强度侵蚀区的景观格局对土壤侵蚀的影响不同,在低强度侵蚀区的影响更为显著。
Relationship between landscape pattern and soil erosion of Huifa River watershed [J].https://doi.org/10.3321/j.issn:1009-2242.2008.03.007 URL [本文引用: 1] 摘要
为分析景观格局对流域土壤侵蚀的影响,本文应用基于GIS的修订通用土壤流失方程(RUSLE),计算了吉林省中低山水蚀区辉发河流域的土壤侵蚀量。选择聚集度、Shannon多样性等6个景观指数,在RS、GIS和Fragstats软件平台下得到两个尺度的土地利用数据和二级土地利用类型的景观指数数据。以流域内29个子流域为样本,用SPSS软件计算侵蚀模数和景观指数的相关性。把29个子流域分为低强度侵蚀区和高强度侵蚀区,分别探讨景观格局对低、高强度侵蚀区土壤侵蚀的影响。结果表明:(1)辉发河流域的土壤侵蚀主要为微度侵蚀和轻度侵蚀,占流域总面积的90.27%。流域平均侵蚀模数为13.89 t/hm~2·a.为轻度侵蚀,但远超过土壤容许流失量。(2)在各种植被类型区中,草地的侵蚀较为强烈,平均侵蚀模数为31.28 t/hm~2·a,高出流域平均侵蚀模数125%,侵蚀贡献水平达到1.74.成为辉发河流域土壤侵蚀的风险区。(3)6个景观指数与侵蚀模数间均存在显著的相关性,除斑块密度外,均与土壤侵蚀模数高度相关。其中聚集度与侵蚀模数的相关性最大,相关系数为—0.602,聚集度和侵蚀模数间有较强的非线性关系。(4)研究区低、高强度侵蚀区的景观格局对土壤侵蚀的影响不同,在低强度侵蚀区的影响更为显著。
|
| [31] |
东北黑土水土流失特点 [J].https://doi.org/10.3969/j.issn.1000-0690.2006.06.008 URL [本文引用: 1] 摘要
Black soils in Northeast China is main agricultural resources for grain production in China. The sustainability of agriculture in Northeast China is jeopardized by soil erosion and degradation of soil fertility. This article took the black soil as a target to analyze its erosion types and characteristics. Surface erosion by water is the most dominant erosion process for the majority of black soils in the region. Many eroded soil materials associated with the runoff have been re-deposited in low-lying land. Reasonable agronomic management practices can conserve black soils from erosion and regain black soil fertility, including contour ploughing and conservation tillage.
Erosion characteristics of black soils in Northeast China [J].https://doi.org/10.3969/j.issn.1000-0690.2006.06.008 URL [本文引用: 1] 摘要
Black soils in Northeast China is main agricultural resources for grain production in China. The sustainability of agriculture in Northeast China is jeopardized by soil erosion and degradation of soil fertility. This article took the black soil as a target to analyze its erosion types and characteristics. Surface erosion by water is the most dominant erosion process for the majority of black soils in the region. Many eroded soil materials associated with the runoff have been re-deposited in low-lying land. Reasonable agronomic management practices can conserve black soils from erosion and regain black soil fertility, including contour ploughing and conservation tillage.
|
| [32] |
Effects of afforestation on runoff and sediment load in an upland Mediterranean catchment [J].https://doi.org/10.1016/j.scitotenv.2015.07.005 URL PMID: 26188652 摘要
61We applied a distributed hydrological model to reconstruct runoff and sediment yield.61Decreasing trends were detected for both variables at the annual and seasonal time scales.61Afforestation seemed to be the main factor driving the trends observed.61An increase in the torrential behaviour and reduction of peak flows was detected.
|
| [33] |
Modelling the impact of climate change on sediment yield in a highly erodible Mediterranean catchment [J].https://doi.org/10.1007/s11368-014-0956-7 URL Magsci 摘要
The assessment of climate change impacts on the sediment cycle is currently a primary concern for environmental policy analysts in Mediterranean areas. Nevertheless, quantitative assessment of climate change impacts is still a complex task. The aim of this study was to implement a sediment model by taking advantage of sediment proxy information provided by reservoir bottom deposits and to use it for climate change assessment in a Mediterranean catchment.<br/>The sediment model was utilised in a catchment that drains into a large reservoir. The depositional history of the reservoir was reconstructed and used for sediment sub-model implementation. The model results were compared with gauged suspended sediment data in order to verify model robustness. Then, the model was coupled with future precipitation and temperature scenarios obtained from climate models. Climatological model outputs for two emission scenarios (A2 and B2) were simulated and the results compared with a reference scenario.<br/>Model results showed a general decrease in soil moisture and water discharge. Large floods, which are responsible for the majority of sediment mobilisation, also showed a general decrease. Sediment yield showed a clear reduction under the A2 scenario but increased under the B2 scenario. The computed specific sediment yield for the control period was 6.33 Mg ha(-1) year(-1), while for the A2 and B2 scenarios, it was 3.62 and 7.04 Mg ha(-1) year(-1), respectively. Furthermore, sediment transport showed an increase in its time compression, i.e. a stronger dependence of total sediment yield from the largest event contributions.<br/>This study shows a methodology for implementing a distributed sediment model by exploiting reservoir sedimentation volumes. This methodology can be applied to a wide range of catchments, given the high availability of reservoir sedimentation data. Moreover, this study showed how such a model can be used in the framework of a climate change study, providing a measure of the impact of climate change on soil erosion and sediment yields.
|
| [34] |
Distributed sediment yield modelling: Importance of initial sediment conditions [J].https://doi.org/10.1016/j.envsoft.2014.04.010 URL 摘要
61Three models were calibrated using three different initial deposit estimation strategies.61A sedigraphs analysis showed that all strategies provided adequate results.61A rating curve analysis proved that the choice of initial conditions affected simulation results.61Manual calibration of initial deposits showed best results in term of clockwise loop reproduction.61Warm-up simulation strategy showed the best results in terms of reproducing different loop shapes.
|
| [35] |
Sediment yield model implementation based on check dam infill stratigraphy in a semiarid Mediterranean catchment [J].https://doi.org/10.5194/hess-17-3339-2013 URL Magsci [本文引用: 1] 摘要
Soil loss and sediment transport in Mediterranean areas are driven by complex non-linear processes which have been only partially understood. Distributed models can be very helpful tools for understanding the catchment-scale phenomena which lead to soil erosion and sediment transport. In this study, a modelling approach is proposed to reproduce and evaluate erosion and sediment yield processes in a Mediterranean catchment (Rambla del Poyo, Valencia, Spain). Due to the lack of sediment transport records for model calibration and validation, a detailed description of the alluvial stratigraphy infilling a check dam that drains a 12.9 km(2) sub-catchment was used as indirect information of sediment yield data. These dam infill sediments showed evidences of at least 15 depositional events (floods) over the time period 1990-2009. The TETIS model, a distributed conceptual hydrological and sediment model, was coupled to the Sediment Trap Efficiency for Small Ponds (STEP) model for reproducing reservoir retention, and it was calibrated and validated using the sedimentation volume estimated for the depositional units associated with discrete runoff events. The results show relatively low net erosion rates compared to other Mediterranean catchments (0.136 Mg ha(-1) yr(-1)), probably due to the extensive outcrops of limestone bedrock, thin soils and rather homogeneous vegetation cover. The simulated sediment production and transport rates offer model satisfactory results, further supported by in-site palaeohydrological evidences and spatial validation using additional check dams, showing the great potential of the presented data assimilation methodology for the quantitative analysis of sediment dynamics in ungauged Mediterranean basins.
|
| [36] |
Recent developments in predictive uncertainty assessment based on the model conditional processor approach [J].https://doi.org/10.5194/hess-15-3253-2011 URL Magsci [本文引用: 1] 摘要
The work aims at discussing the role of predictive uncertainty in flood forecasting and flood emergency management, its relevance to improve the decision making process and the techniques to be used for its assessment.<br/>Real time flood forecasting requires taking into account predictive uncertainty for a number of reasons. Deterministic hydrological/hydraulic forecasts give useful information about real future events, but their predictions, as usually done in practice, cannot be taken and used as real future occurrences but rather used as pseudo-measurements of future occurrences in order to reduce the uncertainty of decision makers. Predictive Uncertainty (PU) is in fact defined as the probability of occurrence of a future value of a predictand (such as water level, discharge or water volume) conditional upon prior observations and knowledge as well as on all the information we can obtain on that specific future value from model forecasts. When dealing with commensurable quantities, as in the case of floods, PU must be quantified in terms of a probability distribution function which will be used by the emergency managers in their decision process in order to improve the quality and reliability of their decisions.<br/>After introducing the concept of PU, the presently available processors are introduced and discussed in terms of their benefits and limitations. In this work the Model Conditional Processor (MCP) has been extended to the possibility of using two joint Truncated Normal Distributions (TNDs), in order to improve adaptation to low and high flows.<br/>The paper concludes by showing the results of the application of the MCP on two case studies, the Po river in Italy and the Baron Fork river, OK, USA. In the Po river case the data provided by the Civil Protection of the Emilia Romagna region have been used to implement an operational example, where the predicted variable is the observed water level. In the Baron Fork River example, the data set provided by the NOAA's National Weather Service, within the DMIP 2 Project, allowed two physically based models, the TOPKAPI model and TETIS model, to be calibrated and a data driven model to be implemented using the Artificial Neural Network. The three model forecasts have been combined with the aim of reducing the PU and improving the probabilistic forecast taking advantage of the different capabilities of each model approach.
|
| [37] |
A monograph on sediment transport in alluvial streams[R]. Hydraulic Engineering Reports. Copenhagen, |
| [38] |
Temporal variations of sediment source from a reservoir catchment in the black soil region, Northeast China [J].https://doi.org/10.1016/j.still.2015.04.009 URL [本文引用: 2] 摘要
An understanding of long term temporal variations in sediment sources from a catchment is necessary to identify the major sources of sediment for effectively implementing soil conservation measures. For this purpose, a sediment column from Qixin reservoir and 410 samples from the three potential sediment sources were collected and radionuclides, soil organic carbon (SOC) and soil texture were analyzed. The relative contributions from different sources were determined using a simple mixing model with 137Cs and 210Pbex. The mean contribution of sediment from cultivated lands to the sediment deposit was 50.87%, varying from 12.22% to 80.84%. Uncultivated lands contributed a mean of 5.22% ranging from 0.01% to 21.49% and gully/channel banks contributed 43.91% ranging from 15.15% to 86.91%. The relative contributions from the cultivated and uncultivated sediment sources to the reservoir deposit were significantly (P=0.01) correlated with radioactivities, SOC and D50. The temporal variations of sediment source were determined by yearly rainfall amount and rainfall erosivity. The results indicate that conservation practices should be prioritized in the cultivated lands and gullies/channels and temporal preparation strategies for heavy rainstorms should be considered using physical soil erosion models combined with field investigation.
|
| [39] |
Impact of land use change and dam construction on soil erosion and sediment yield in the black soil region, Northeastern China [J].
Since the 1960s, the implemented soil conservation measures on steep slopes and the densely planted shelterbelts as well as the constructed reservoirs and ponds in Baiquan County, northeastern China have...
|
| [40] |
Split-parameter structure for the automatic calibration of distributed hydrological models [J].https://doi.org/10.1016/j.jhydrol.2006.06.032 URL [本文引用: 2] 摘要
Hydrological distributed models demand large amounts of data, information and parameters in order to accurately represent the spatial variability of the main hydrological processes and inputs. The parameter estimation is always a complex and expensive task which is often unaffordable and therefore hydrologists are frequently forced to disregard distributed modelling in favour of lumped or semidistributed models. To solve this situation, we propose in this paper to split the effective parameter at each cell in two components: the hydrological characteristic (at point scale and maintaining its physical meaning) and a correction factor (common for all cells and taking into account all modelling errors including the temporal and spatial scale effects). The new split-parameter structure adopted in our distributed model (called TETIS) is coupled with the SCE-UA automatic optimization method in order to obtain the set of optimal correction factors of the model, without loosing the spatial variability described by the a priori estimated hydrological characteristics. Automatic procedures can be easily adapted to the split-parameter structure because the number of variables to be calibrated is dramatically reduced from thousands of cell parameters to a small number of common correction factors (one for each parameter map). Also, the optimum initial values of the state variables can be obtained automatically. In order to show the advantages of the new structure a real application is performed in a case study in which the calibration and the spatial and spatial鈥搕emporal validation processes have been carried out. The results can be considered as being excellent and it is concluded that automatic calibration with the SCE-UA algorithm has been shown to be reliable and fast.
|
| [41] |
Mechanics of soil erosion from overland flow generated by simulated rainfall[R]. Hydrology Paper No. 63. Fort Collins, CO: |
| [42] |
Exploration of sub-annual calibration schemes of hydrological models [J]. |
| [43] |
How changing rainfall regimes may affect the water balance: A modelling approach in West Africa [ |
| [44] |
The hydraulic geometry of stream channels and some physiographic implications[R]. Geological Survey Professional Paper 252. Washington, DC: |
| [45] |
Model evaluation guidelines for systematic quantification of accuracy in watershed simulations [J].https://doi.org/10.13031/2013.23153 URL [本文引用: 2] 摘要
This study makes recommendations for watershed model validation criteria for streamflow, sediment, and nutrients based on up-to-date model performance criteria review and a review of papers which recommend model validation criteria for hydrologic models and important considerations in selecting model validation criteria. In addition, the study recommends general suitable guideline value ranges for the selected criteria based on reported model validation guidelines for the selected quantitative criteria, reported values for recommended quantitative criteria for validation of selected models, and important considerations [especially measured data uncertainty] in selecting suitable model validation guidelines. Factors are discussed that can be used to justify making the guidelines more or less strict.
|
| [46] |
Patterns of runoff and sediment production in response to land-use changes in an ungauged Mediterranean catchment [J].https://doi.org/10.1016/j.jhydrol.2015.11.014 URL [本文引用: 1] 摘要
Modelling hydrology and sediment yield and its scale dependency has been limited by the quantity and quality of instrumental data. This paper aims to apply alternative methods to estimate runoff and sediment production rates at the event-scale and to characterize the hydro-sedimentary response of a highly torrential Mediterranean catchment to historical changes in land use and vegetation. A selection of well-dated and spatially-distributed check dams within the catchment were used to calibrate and validate a hydro-sedimentary distributed model (TETIS). Sediment volumes deposited by individual runoff events and trapped in check dams were estimated on the bases of detailed stratigraphic descriptions and subsequent GPS/TLS surveys. The model results showed a good agreement with the observed water flows and sediment volumes deposited behind several check dams. Management and land uses proved to be a decisive factor in the hydrological behaviour of the catchment, especially affecting erosion and sediment yield. It was observed that while the hydrological response of the catchment was sensitive to the percentage of each land use type, the sedimentary response was more dependent on the spatial distribution of land use. These differences between hydrology and sedimentary behaviour imply that the optimal soil use distribution for soil conservation may differ from the optimal soil use scenario oriented to attenuate flood peaks. This study suggest that soil use policies and erosion mitigation strategies should consider a holistic hydro-sedimentary approach, in order to become an adaptive option to reduce and mitigate the effects of erosion and flood peaks under global change.
|
| [47] |
Land use can offset climate change induced increases in erosion in Mediterranean watersheds [J].https://doi.org/10.1016/j.catena.2016.04.012 URL [本文引用: 1] 摘要
61Downscaling with GCM anomalies provided projected climatic stochastic time series.61Climate change reduces the number and increase the magnitude of heavy rainfall events.61Runoff and sediment production are more sensitive to land use change than to climate change.61Sediment yields is more sensitive to land use changes than runoff.61Land use management can be an option for adaptation to climate change effects.
|
| [48] |
Climate change impacts on discharges of the Rhone River in Lyon by the end of the twenty-first century: Model results and implications [J].https://doi.org/10.1007/s10113-014-0707-8 URL [本文引用: 1] 摘要
We assess possible modifications in the hydrological behaviour of the Rhone River and its tributaries at Lyon (France). We identify changes during the late-twentieth century based on observations and characterise potential impacts of climatic changes on river response by the end of the century. Different scenarios of the latest generation of IPCC AR5 CMIP5 and hydrological modelling were used and included two scenarios for future outlet discharge of Lake Geneva (Switzerland). We show that discharges in the Rhone basin are likely to decrease significantly by the end of the century and that the seasonality of run-off will change substantially as well. In addition, projections point to smaller discharge during low flows, but higher low flows in its sub-basins. Regarding floods, high flows exhibit a general tendency to decrease, whereas potential upwards can be observed for the more extreme floods (less frequent). The approach reported in this paper will help to reflect on the governance modalities of a transboundary river such as the Rhone, especially when water management depends on concession contracts, which are usually granted for several decades and typically last between 60 and 90years.
|
| [49] |
GIS-based upland erosion modeling, geovisualization and grid size effects on erosion simulations with CASC2D-SED[D]. Fort Collins, US: |
| [50] |
A comparative analysis of the effectiveness of flood management measures based on the concept of "retaining water in the landscape" in different European hydro-climatic regions [J].https://doi.org/10.5194/nhess-12-3287-2012 URL [本文引用: 1] 摘要
In this paper, we analyse the effectiveness of flood management measures based on the concept known as "retaining water in the landscape". The investigated measures include afforestation, micro-ponds and small-reservoirs. A comparative and model-based methodological approach has been developed and applied for three meso-scale catchments located in different European hydro-climatological regions: Poyo (184 km) in the Spanish Mediterranean, Upper Iller (954 km) in the German Alps and Kamp (621 km) in Northeast-Austria representing the Continental hydro-climate. This comparative analysis has found general similarities in spite of the particular differences among studied areas. In general terms, the flood reduction through the concept of "retaining water in the landscape" depends on the following factors: the storage capacity increase in the catchment resulting from such measures, the characteristics of the rainfall event, the antecedent soil moisture condition and the spatial distribution of such flood management measures in the catchment. In general, our study has shown that, this concept is effective for small and medium events, but almost negligible for the largest and less frequent floods: this holds true for all different hydro-climatic regions, and with different land-use, soils and morphological settings.
|
| [51] |
Teaching hydrological modeling with a user-friendly catchment-runoff-model software package [J].https://doi.org/10.5194/hessd-9-5905-2012 URL [本文引用: 1] 摘要
Computer models, especially conceptual models, are frequently used for catchment hydrology studies. Teaching hydrological modeling, however, is challenging, since students have to both understand general model concepts and be able to use particular computer programs when learning to apply computer models. Here we present a new version of the HBV (Hydrologiska Byrans Vattenavdelning) model. This software provides a user-friendly version that is especially useful for education. Different functionalities, such as an automatic calibration using a genetic algorithm or a Monte Carlo approach, as well as the possibility to perform batch runs with predefined model parameters make the software interesting especially for teaching in more advanced classes and research projects. Different teaching goals related to hydrological modeling are discussed and a series of exercises is suggested to reach these goals.
|
| [52] |
EPIC-erosion/productivity impact calculator: Model documentation [M].
|
| [53] |
Input data resolution analysis for distributed hydrological modeling [J].https://doi.org/10.1016/j.jhydrol.2005.04.025 URL 摘要
A distributed hydrological model is often needed to analyze spatially variable hydrologic behavior. Such a model can be difficult to set up, especially for an ungauged basin, as it demands a massive amount of data. Moreover, there is an additional challenge of selecting a proper grid resolution as the grid size selection generally leads to predictive uncertainty and also directly determines the amount of work required. In this study, a distributed macro-scale hydrological model, named as the MaScOD model, is applied with a 10-min spatial resolution to the Huaihe River basin, China, to simulate discharge at Bengbu (132,350 km 2) and at sub-basins at Wangjiaba (29,844 km 2) and at Suiping (2093 km 2). A range of input data resolutions are used, from 10 min to 2.5, based on an experimental hydro-meteorological input data set abstracted from the GAME re-analysis data and the Hubex-IOP EEWB data. Performance of the model is evaluated by comparing observed discharge against simulated discharge for a range of IC-ratio values (the ratio between the input forcing resolution and the Catchment area). Similar results are obtained for all three catchments, despite their different sizes. It is found that improvement in distributed model performance is more pronounced below the IC-ratio 1:10, whereas the rate of improvement is negligible above the IC-ratio 1:20. The IC-ratio range 1:10-1:20 is found to be the optimum performance range considering the data and resource demands of distributed models. This may provide a preliminary criterion for selecting the scale for distributed hydrological modeling in ungauged basins.
|
| [54] |
Changes in soil organic carbon, nitrogen, pH and bulk density with the development of larch (Larix gmelinii) plantations in China. https://doi.org/10.1111/j.1365-2486.2011.02447.x URL Magsci [本文引用: 1] 摘要
Under the government of China's environmental program known as Returning Farmland To Forests (RFTF), about 28 million hectares of farmland have been converted to tree plantation. This has led to a large accumulation of biomass carbon, but less is known about underground carbon-related processes. One permanent plot (25 years of observation) and four chronosequence plot series comprising 159 plots of larch (Larix gmelinii) plantations in northeastern China were studied. Both methods found significant soil organic carbon (SOC) accumulation (96.4 g C m(-2) yr(-1)) and bulk density decrease (5.7 mg cm(-3) yr(-1)) in the surface soil layer (0-20 cm), but no consistent changes in deeper layers, indicating that larch planting under the RFTF program can increase SOC storage and improve the physical properties of surface soil. Nitrogen depletion (4.1-4.3 g m(-2) yr(-1)), soil acidification (0.007-0.022 pH units yr(-1)) and carbon/nitrogen (C/N) ratio increase (0.16-0.46 per year) were observed in lessive soil, whereas no significant changes were found in typical dark-brown forest soil. This SOC accumulation rate (96.4 g m(-2) yr(-1)) can take 39% of the total carbon sink capacity [net ecosystem exchange (NEE)] of larch forests in this region and the total soil carbon sequestration could be 87 Tg carbon within 20 years of plantation by approximating all larch plantations in northeastern China (4.5 Mha), showing the importance of soil carbon accumulation in the ecosystem carbon balance. By comparison with the rates of these processes in agricultural use, the RFTF program of reversing land use for agriculture will rehabilitate SOC, soil fertility and bulk density slowly (<69% of the depletion rate in agricultural use), so that a much longer duration is needed to rehabilitate the underground function of soil via the RFTF program. Global forest plantations on abandoned farmland or function to protecting farmland are of steady growth and our findings may be important for understanding their underground carbon processes.
|
| [55] |
Effects of spatial variability and scale with implications to hydrologic modeling [J].https://doi.org/10.1016/0022-1694(88)90090-X URL [本文引用: 1] 摘要
This paper reports the results of a preliminary investigation into the existence of a Representative Elementary Area (REA) in the context of hydrologic modeling at the catchment scale. The investigation was carried out for an actual catchment topography as represented by Coweeta River experimental basin with synthetic realizations for rainfall and soils. The hydrologic response of this catchment was modeled by a modified version of topmodel Beven and Kirkby (1979) which is capable of modeling both infiltration excess and saturation excess runoff and incorporating the spatial variability of soils, topography, and rainfall. The effect of scale was analyzed by first dividing the catchment into smaller subcatchments and determining the average water fluxes for each subcatchment. The preliminary results lead to the following conclusions: (1) a Representative Elementary Area (REA) exists in the context of catchment hydrologic responses; (2) the REA is strongly influenced by the topography; and (3) based on our initial results, the length scale of rainfall seems to have only a secondary role in determining the size of the REA; however, increases in the variability of rainfall and soils between subcatchments increase the variability of runoff generation between subcatchments.
|
| [56] |
Investigating the representative elementary area concept: An approach based on field data [J].https://doi.org/10.1002/hyp.3360090306 URL 摘要
Changing the scale of observation or averaging has a significant, but poorly understood, impact on the apparent variability of hydrological quantities. The representative elementary area (REA) concept is used as a motivation for measuring inter-storm streamflow and calculating wetness index distributions for the subcatchments of two small study areas in New Zealand. Small subcatchments are combined to provide larger scale samples, and then the variance of specific discharge between similar sized subcatchments is calculated. For small subcatchments (area less than 1 km2) this variance is found to decrease with area more quickly than might be expected if the catchments were random samples. Such behaviour is tentatively interpreted as evidence supporting the concept of organization. At larger scales, variance between catchments decreases in a way that is consistent with sampling from a stationary random field. The results from the streamflow data are reinforced by an analysis of topographic data for the two study areas, although some questions remain open. Both the flow and topographic data support the idea that it is possible to find an averaging scale where the variability between catchments is sufficiently small for a distribution function approach to be used in distributed rainfall-runoff modelling. Consistent estimates of the scale at which the study areas become stationary (0.5 km2 for Little Akaloa, 2 km2 for Lewis) are obtained using both flow and topographic data. The data support a pragmatic REA concept which allows meaningful averages to be formed: this may be a useful base for further conceptual developments, but it is not appropriate for a classical continuum approach. Further conceptual development combined with field measurement and computer simulation are still required for the REA to have operational impacts. In particular, it is not clear which models are appropriate for use at the REA scale.
|
| [57] |
Soil organic carbon stocks in China and changes from 1980s to 2000s [J].https://doi.org/10.1111/j.1365-2486.2007.01409.x URL [本文引用: 1] 摘要
The estimation of the size and changes of soil organic carbon (SOC) stocks is of great importance for decision makers to adopt proper measures to protect soils and to develop strategies for mitigation of greenhouse gases. In this paper, soil data from the Second State Soil Survey of China (SSSSC) conducted in the early 1980s and data published in the last 5 years were used to estimate the size of SOC stocks over the whole profile and their changes in China in last 20 years. Soils were identified as paddy, upland, forest, grassland or waste-land soils and an improved soil bulk density estimation method was used to estimate missing bulk density data. In the early 1980s, total SOC stocks were estimated at 89.61 Pg (1 Pg=10(3) Tg=10(15) g) in China's 870.94 Mha terrestrial areas covered by 2473 soil series. In the paddy, upland, forest and grassland soils the respective total SOC stocks were 2.91 Pg on 29.87 Mha, 10.07 Pg on 125.89 Mha, 34.23 Pg on 249.32 Mha and 37.71 Pg on 278.51 Mha, respectively. The SOC density of the surface layer ranged from 3.5 Mg ha(-1) in Gray Desery grassland soils to 252.6 Mg ha(-1) in Mountain Meadow forest soils. The average area-weighted total SOC density in paddy soils (97.6 Mg ha(-1)) was higher than that in upland soils (80 Mg ha(-1)). Soils under forest (137.3 Mg ha(-1)) had a similar average area-weighted total SOC density as those under grassland (135.4 Mg ha(-1)). The annual estimated SOC accumulation rates in farmland and forest soils in the last 20 years were 23.61 and 11.72 Tg, respectively, leading to increases of 0.472 and 0.234 Pg SOC in farmland and forest areas, respectively. In contrast, SOC under grassland declined by 3.56 Pg due to the grassland degradation over this period. The resulting estimated net SOC loss in China's soils over the last 20 years was 2.86 Pg. The documented SOC accumulation in farmland and forest soils could thus not compensate for the loss of SOC in grassland soils in the last 20 years. There were,
|

/
| 〈 |
|
〉 |