任宇飞 , 方创琳
, 方创琳
REN Yufei, FANG Chuanglin
通讯作者:
收稿日期: 2016-12-20
网络出版日期: 2017-01-20
版权声明: 2017 地理科学进展 《地理科学进展》杂志 版权所有
基金资助:
作者简介:
作者简介:任宇飞(1990-),男,甘肃兰州人,硕士研究生,主要从事城市群可持续发展研究,E-mail: renyuf@126.com。
展开
摘要
京津冀城市群地区是国家经济发展的战略核心区之一,其经济发展与资源环境关系是近年来地理研究的重点领域。本文以京津冀城市群县域为单元,利用PM2.5、NO2遥感反演等数据,设计资源投入—经济效益—环境影响复合生态效率评价指标体系,构建县域单元生态效率评价模型,并利用非期望产出SBM模型对生态效率进行了评价,运用空间自相关分析方法对生态效率的空间效应与空间关联模式进行了检验与分析。结果显示:①资源投入、经济效益与环境影响格局存在明显时空分异,高值区主要分布在京津唐三市及周边部分县区;②2006、2010、2014年3个时期京津冀城市群县域单元生态效率均值分别为0.324、0.305、0.347,总体水平较低,并呈现先下降后改善态势,区位、自然本底条件是导致生态效率空间差异的主要原因。③全局Moran's I指数分别为0.2539、0.3007、0.3088,表明县域单元生态效率存在空间正向集聚趋势;④县域单元生态效率正向集聚程度越来越显著,邻域单元生态效率差距则有所缩减。
关键词:
Abstract
Urbanization in China has resulted in an increased consumption of resources, energy, and materials and led to negative environmental effects. Urban agglomeration plays pivotal roles in the China's new urbanization. These factors have motivated the widely discussed topic of urban agglomeration's eco-efficiency. This research developed an index system of eco-efficiency and evaluated the eco-efficiency of counties in the Beijing-Tianjin-Hebei Urban Agglomeration using the modified Topsis model for the spatial pattern of consumption of resources, economic benefit, and environmental pollution outputs. We also quantified eco-efficiency by the undesirable-output SBM model in 2006, 2010, and 2014 using environmental pollution as an undesirable output. Spatial autocorrelation index and local Moran's I index were used to analyze the spatial correlation pattern of eco-efficiency at the county level in the study area. The results show that there exist significant spatiotemporal differences of consumption of resources, economic benefit, and environmental pollution outputs. The Beijing-Tianjin-Hebei area had high values of inputs and outputs in the research period. Eco-efficiency of counties in the Beijing-Tianjin-Hebei Urban Agglomeration was relatively low. Mean values of eco-efficiency were 0.324, 0.305, and 0.347 in 2006, 2010, and 2014. It decreased first and then increased. The reasons for the spatial differences of eco-efficiency are location and natural backgrounds, and low economic benefit and high environmental impact are the main factors that restrict the improvement of eco-efficiency. The global Moran's I index values were 0.2539, 0.3007, and 0.3088, indicating that the impact factors of eco-efficiency were not only related to the economic development level of each county unit, but also associated with the eco-efficiency of adjacent counties. The positive agglomeration effect has been increasingly obvious since 2006, and the gap of eco-efficiency of neighboring counties has reduced.
Keywords:
京津冀城市群不仅是中国核心经济区的重要组成部分(陆大道, 2015),也是目前全国“5+9+6”城市群建设新格局中的5个特大城市群之一(方创琳等, 2016)。改革开放以来,京津冀城市群社会经济取得了快速发展,但区域人口高度集中,以及高耗能、高污染、低收益的产业发展模式仍未得到根本改变,社会经济发展对资源的巨大需求与消耗,导致生态环境恶化等问题愈加凸显。近年来,京津冀城市群地区大面积、长时段的极端雾霾天气屡见不鲜,区域“污染同受”不良现象频繁发生,社会经济发展引发的环境问题成为制约京津冀城市群健康发展的重要因素。在党和国家提出将生态文明理念全面融入城市发展以及京津冀协同发展上升为国家战略的背景下,量化及协调京津冀城市群经济发展与资源环境间关系,是面向国家战略需求,对推动地区社会、经济、生态的高效与可持续发展具有至关重要的作用。
生态效率集中体现了经济发展与资源环境利用关系,可综合测度资源环境的利用程度及其与经济效率、环境影响的协调程度。Burritt等(2001)提出的生态效率概念,兼顾经济活动的环境效益与经济效益,其核心思想在于以较少的资源投入、较小的环境代价创造较高的社会经济价值。针对生态效率问题,国内外相关文献主要集中在生态效率内涵定义(Division, 2010)、测度指标体系及方法(Lin et al, 2010)、生态效率的收敛性及其影响因素(涂正革等, 2011)、生态效率的空间差异特征(Yin et al, 2014)等。国外学者以微观的行业(Quariguasi-Frota-Neto et al, 2012;Egilmez et al, 2014)、企业(Hahn et al, 2010)、工业部门(Arabi et al, 2014)为主,而国内学者多以宏观层面的城市(李惠娟等, 2010)、区域层面(Yu et al, 2013)为主。目前生态效率研究主要包括以下3类:①根据研究单元的空间尺度及其特性,建立相应的评价指标体系,通过成本效益分析(cost-benefit analysis)、生命周期成本分析(life cycle costing)(Huppes et al, 2005)等方法将多指标集成为单一指标,对研究对象的生态效率进行测度,其主要缺点在于指标体系的选取以及指标的综合集成具有一定的随意性和主观性;②将城市视为有机生物体,通过能值分析(emergy analysis)(Li et al, 2011)、物质流分析(material flow analysis)(Gurauskienė et al, 2011)、生态足迹(ecological footprint)(Cerutti et al, 2013)等方法评价城市经济发展过程中物质与资源的转换效率。该方法的难点主要在于构建指标体系受数据可获性影响较大,由于数据的缺失,往往以典型行业、城市为研究对象,如北京市(Zhang et al, 2011)等;③利用数学模型进行求解。基于城市经济—生态系统的复杂性,此类研究采用对数据进行加权处理的方法将不同维度的指标进行集成,因模型法可避免权重赋值的主观性,是现阶段城市生态效率研究的主要手段。目前应用较广泛的模型主要有DEA(Yin et al, 2014)、UMM(Liu et al, 2010)、LCI(Frischknecht, 2010)、VSM(Plehn et al, 2012)、TOPSIS(韩瑞玲等, 2011)等。其中DEA模型因其具有所需指标少、指标原始信息保存完整等优势,成为目前学术界使用较多的模型之一。DEA模型包括CRS、VRS、SBM、三阶段DEA、Malmquist指数、超效率DEA模型等,因SBM模型能较好处理资源要素消耗过程中伴随的负向环境污染产出(Huang et al, 2014),得到了学界的广泛应用。相关研究主要有:潘丹等(2013)利用SBM模型对1998-2009年中国30个省份农业生态效率进行的实证分析;关伟等(2015)运用非期望产出SBM模型对中国1997-2012年省际能源生态效率进行测度,分析能源生态效率的空间特征,并用空间计量模型分析其影响因素;胡彪等(2016)采用产出SBM模型对中国省域生态效率进行测度,运用空间自相关分析法分析了生态效率全局及局域的空间差异。
总体而言,上述研究逐渐从静态、定性现状分析转向动态、定量趋势评价,为进一步研究生态效率奠定了基础。但以上研究忽略了地区更小尺度的县域单元间要素空间关联特征对生态效率的影响,也缺乏对于特大城市群地区县域生态效率协调发展状态的详细研究,以及从大气污染角度出发对生态效率进行评价。近期,Wachsmuth等(2016)在著名期刊“Nature”发表文章,认为对于未来城市可持续发展研究,应将视角从孤立的点状城市转向相互联系紧密的面状城市区域,探讨经济、资源等要素在全球或区域城市网络中的流动作用,即关注不同城市区域间经济、资源等要素在地理空间中的溢出效应所带来的诸多影响。作者认为,社会经济要素通过空间异质性、空间依赖性及空间集聚机制、扩散机制发挥影响作用,并改变了城市生态效率的空间格局。因而深入研究生态效率的空间作用机制以及与经济互动关系,对综合评价京津冀城市群县域单元经济发展与资源环境关系具有重要的指导意义。据此,首先构建大气污染制约下的生态效率评价指标,利用遥感数据与社会统计数据构建生态效率分析数据库,采用熵技术支持下的TOPSIS模型对资源投入、经济效益和环境影响进行综合集成并进行评价;其次,利用基于非期望产出的SBM模型对2006-2014年京津冀城市群县级行政单元生态效率进行测度;最后,运用空间计量模型验证生态效率的空间效应。
TOPSIS模型又称“逼近理想排序法”,是距离综合评价法之一。模型优点为可操作性和客观性,对样本需求不大且结果合理(马雪莹等, 2016)。本文依据生态环境定义将指标分为3类,即资源投入、经济效益、环境影响。采用熵技术支持下的TOPSIS模型进行综合集成。该模型是利用熵权法对传统TOPSIS评价法中权重确定环节进行了改善,其主要计算步骤如下:
(1) 构建评价指标体系矩阵(X)。假设被评价对象有m个,每个评价对象的评价指标有n个,构建判断矩阵:
式中:i为被评价对象;j为评价指标;m为评价对象总数;n为评价指标总数。
(2) 采用极值法对指标矩阵标准化:
式中:R为标准化后的评价指标体系矩阵;rij为第i个被评价对象在第j个评价指标上的标准值。
(3) 计算信息熵(
式中:
(4) 定义指标j的权重(
式中:
(5) 计算规范化后的加权矩阵(Z):
式中:
(6) 确定最优解
(7) 计算各方案与最优解(
(8) 计算综合评价指数(Ci):
式中:Ci值越大,表征评价对象越优。
SBM模型由Tone(2001)提出和发展,属于非径向和非角度的DEA模型。SBM模型通过将松弛变量放入目标函数中,弥补了传统DEA模型大多属于径向和角度度量,缺乏对投入产出松弛问题的考虑的欠缺,能更有效评价非期望产出下的效率问题(涂正革等, 2011)。模型表达为:
式中:ρ代表效率值;N、M、I分别代表投入、期望产出与非期望产出的个数;n、m、i分别代表投入、期望产出与非期望产出的指标类型;t表示时间;x,y,b表示松弛变量类型;
空间自相关是空间单元属性值集聚程度的表征。全局空间相关测度研究区域内所有空间对象的总体关联程度、空间分布模式及其显著性,全局Moran's I指数为:
式中:xi为城市i的观测值;n为观测值数目;
式中:如果I显著为正,则表明存在正向空间相关性,生态效率值较高(低)的区域在空间上呈集聚形态。全局自相关假定空间同质,无法反映局部集聚特征,需要进一步进行局部空间自相关分析。局部空间自相关反映每个城市与相邻城市之间的空间关联程度,局部Moran's I指数为:
式中:Ii为城市i的局部Moran's I指数;Zi为Z标准化后城市i的生态效率值;Wij为空间权重矩阵。局部Moran's I指数为正(负)表示相似(异)类型属性值要素空间邻近,绝对值越大表示邻近程度越高。局部空间自相关可识别局部单元属性在相邻区域中的自相关性,将集聚类型划分为H-H、H-L、L-L、L-H集聚4种类型。
2.4.1 研究单元及数据来源
中国行政区划中市县级行政单元包括县(含自治县)、县级市、市辖区3个类别。本文选择京津冀城市群地区共153个县级行政单元为研究对象,研究时段为2006、2010和2014年。县(含自治县)和县级市数据主要来源于《中国区域统计年鉴(2007、2011)》、《中国县(市)社会经济统计年鉴(2007、2011、2015)》、各县(市)历年《国民经济和社会发展统计公报》以及北京市、天津市、河北省统计年鉴和一手调研资料,市辖区数据主要通过《中国城市统计年鉴(2007、2011、2015)》获取。大气污染物PM2.5、NO2数据来源于大气成分分析组织(ACAG)利用美国国家航天航空局(NASA)提供的MODIS、MISR以及SeaWIFS等遥感数据,对气溶胶光学厚度(AOD)进行合并计算反演出的地表大气污染数据,栅格分辨率为1 km(van Donkelaar et al, 2016; Geddes et al, 2016)。
2.4.2 生态效率评价指标
在对以往生态效率相关定义进行梳理、辨析的基础上,本文定义生态效率为:城市社会经济发展中所创造的期望经济效益与非期望环境影响产出和与城市有效利用的资源投入的比率,即
表1 京津冀城市群县域单元生态效率测度指标体系
Tab.1 Evaluation indicators of eco-efficiency in counties of the Beijing-Tianjin-Hebei Urban Agglomeration
| 指标类型 | 一级指标 | 二级指标 |
|---|---|---|
| 投入指标 | 资本要素投入 | 全社会固定资产投资总值、政府财政预算支出 |
| 人力投入 | 年末人口总数 | |
| 产出指标 | 经济效益(期望产出) | GDP、工业生产总值、政府财政预算收入 |
| 环境影响(非期望产出) | PM2.5浓度、NO2浓度 |
本文采用熵技术支持下的TOPSIS模型将生态效率指标分别集成为综合资源投入、经济效益、环境影响指数,通过Jenks最佳自然断裂法对集成结果进行分类并保证不同时段分类标准一致,以对集成综合指数进行时空格局分析(为便于展示,对综合集成结果乘以100)。
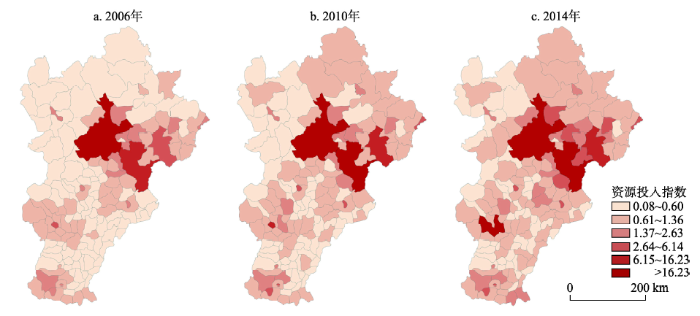
3.1.1 县域资源投入时空分异
如图1所示,京津冀城市群县域单元资源投入格局存在明显的时空分异,且呈明显的高值区与低值区分化格局。从时序格局变化来看,京津和位于燕山山前平原地区的唐山市辖区在整个研究时段中均为高值区,周边县域资源投入水平随时间呈相对上升趋势,表明该地区依靠京津唐市辖区较强的社会经济发展实力,使得要素集聚效应不断强化,对周边县区的辐射带动作用不断增强。第二类高值区为河北省沿海地区,包括秦沧辖区及周边县区。该区域位于沿海新兴增长区域,是国家重点优化开发区,也是京津城市功能拓展和产业转移的重要承接地。2010年以后,该区域投入规模得到明显提升。第三类高值区位于冀中南地区。石保邢邯地区是河北省工业化水平、基础设施配套程度、科技文化资源集聚规模相对较高的区域,其资源投入指数在整个研究时段中不断上升,四市市辖区周边县域单元资源投入指数由低值区向高值区转变明显。特别是石家庄地区伴随省会城市地位的不断提升,以及鹿泉、栾城和藁城的撤县设区,资源投入规模得到进一步加大,对周边地区的辐射作用得到一定提高。
图1 2006-2014年京津冀城市群县域资源投入指数时空分异格局
Fig.1 Spatiotemporal patterns of resource input in counties of the Beijing-Tianjin-Hebei Urban Agglomeration, 2006-2014
资源投入低值区主要位于河北省北部及西南部地区。北部地区多为高原山地,为国家及省级重点生态功能区,是保障京津冀生态安全的重要区域,因此开发强度较低,资源投入相对较少。西南部县域单元主要为农产品主产区,是国家黄淮海平原农产品主产区的重要组成部分,工业化与城镇化建设强度低,因此资源投入同样相对较少。
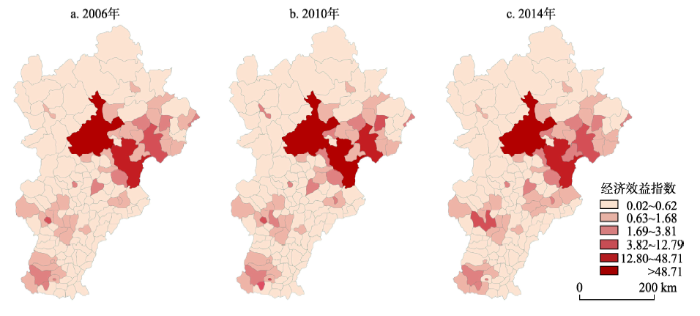
3.1.2 县域经济效益空间分异
京津冀城市群县域经济效益格局存在明显的空间分异,经济效益由沿海地区向内陆地区逐步递减,格局随时间基本保持稳定(图2)。第一类高值区分布在京津地区以及河北省沿海地区。京津市辖区作为京津冀城市群的两大核心,发展起步早,经济本底雄厚,经济效益远远高于其他地区。河北省沿海地区包括唐、秦、沧三市辖区及周边部分县区,该区域经济发展区位条件优越,工业基础较为雄厚,经济发展模式具有一定的外向型特征,经济效益相对较高。第二类高值区包括冀中南地区的石、邯两市辖区及周边县区,此区域在河北省内工业化发展水平相对较高,现代服务业发展势头强劲,集聚一批装备制造、石油工业、冶金等重工业类型产业,经济效益相对周边地区较高。
图2 2006-2014年京津冀城市群县域经济效益指数时空分异格局
Fig.2 patiotemporal patterns of economic benefit in counties of the Beijing-Tianjin-Hebei Urban Agglomeration, 2006-2014
经济效益低值区则主要分布在河北省西北部与西南部。西北部坝上高原山地区和冀北燕山山区为重点生态功能区,是京津和冀东地区的生态屏障,产业发展类型与规模受到一定约束,因此经济效益较低。西南部的黑龙港中北部部分平原地区是国家粮、棉、油等农产品重要的集中产区,农业地位突出,经济效益产出同样较低。
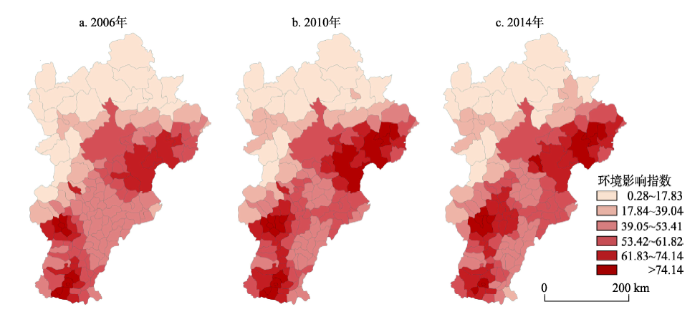
3.1.3 县域环境影响时空分异
京津冀城市群县域环境影响指数格局呈明显的时空分异,但不同于资源投入和经济效益的空间格局,呈大范围、连片蔓延分布的空间特征(图3)。第一类高值区主要分布在津唐地区,该区经济发展水平与资源投入与经济效益均相对较高,近年来随着城市与工业规模的不断扩大,环境与社会经济发展矛盾愈加凸显。2006-2010年间,津唐市辖区及周边部分县域单元环境影响指数呈上升趋势,成为沿海环境污染核心区;北京市辖区及周边县域单元环境影响指数则保持稳定态势,污染水平相对周边县区较低。2010-2014年间,天津市辖区环境影响指数有所下降,环境污染问题得到一定程度缓解,但唐山地区县域单元环境污染情况依然较重,显然与唐山市周边钢铁等重工业企业分布密集、产能集中度过高有关。由于重工业高耗能、高排放的特性使得该区成为环境污染聚集区。第二类高值区主要分布在冀中南地区。从整个研究时段来看,石、邯两市辖区环境影响指数始终较高,周边邻近县区环境影响指数随时间上升趋势明显,尤其以石家庄为核心向保定、沧州方向逐渐出现连片高值区。该区环境影响指数高的现状主要是由于冀中南地区产业结构粗放、产业层次偏低所致。冀中南地区第一产业和传统工业规模大,而新兴产业规模相对较低,工业仍以钢铁、建材煤化工等资源密集型传统工业为主,主导产品以钢铁、原煤、水泥、原盐、化学原材料等为主,生产过程中因化石燃料燃烧产生的空气污染物排放量始终较高。
图3 2006-2014年京津冀城市群县域环境影响指数时空分异格局
Fig.3 Spatiotemporal patterns of environmental pollution in counties of the Beijing-Tianjin-Hebei Urban Agglomeration, 2006-2014
低值区则分布在河北省北部及西北部地区,这与资源投入、经济效益的低值区格局保持一致。西北部坝上高原山地区和冀北燕山山区绿色农产品加工业、生态产业发展较快。近年来,该区大力发展生态旅游、休闲度假服务业以及建设绿色农产品和生态产业基地,因此空气污染物排放量相对较少,环境影响指数始终较低。
根据评价指标体系,分别选择2006、2010、2014年,将京津冀城市群的153个县域单元作为决策单元,计算出3个时期京津冀城市群县域生态效率值(图4)。计算结果表明:3个时期京津冀城市群县域单元生态效率总体水平较低,均值分别为0.324、0.305、0.347,呈现先下降后改善态势。在研究时段均达到DEA效率最优前沿面的有京津唐市辖区以及迁安市、任丘市、围场满族蒙古族自治县。从3个研究时段生态效率值分类后数量及占比情况来看:①县域单元数量占比最多的区间为0.200以下和0.201~0.400。其中,2006年与2010年生态效率值在0.200以下的县域单元数量相同,均为55个,占总数的36%。2014年该区间单元数量有所下降,为45个,占总数的29%,与之前相比下降7%;②生态效率值在0.201~0.400之间的县域单元数量在研究时期分别为62、66、69个,占总数的40%、43%、45%,2014年该区间单元数量有所上升;③0.401~0.999区间县域单元数量分别为23、22、24个,占总数的15%、14.3%、15.7%,整体变动幅度较小;④达到DEA效率前沿面的县域单元数量分别为13、10、12个,占总数的8.5%、6.5%、7.8%,整体变化幅度同样相对较小。综上所述,生态效率值均为1的县域单元数量稀少,多数单元生态效率值位于0.400以下。县域单元生态效率值整体得到改善的原因为0.200以下区间的县域单元数量有所减小,低值区县域单元生态效率值得到一定提高。
图4 2006-2014年京津冀城市群县域生态效率空间分异
Fig.4 Spatiotemporal patterns of Eco-efficiency in counties of the Beijing-Tianjin-Hebei Urban Agglomeration, 2006-2014
在分析生态效率空间分异特征的基础上,将其值与资源投入、经济效益、环境影响指数进行对应分析,以发现生态效率值与投入产出指标的协调关系。如图4所示,生态效率各区间空间格局分异明显,格局随时间变化相对稳定。从生态效率值分类结果来看:①生态效率值在0.200以下的县域单元主要分布在河北省西北部坝上高原山地区、冀北燕山山区以及河北省西南部地区。此类县域位于重点生态功能区和国家农产品主产区,距离区域核心城市空间距离较远。受核心市辖区辐射带动力弱以及产业发展类型与规模受限的约束,使得其投入要素集中度、期望经济效益和非期望环境产出均相对较低。生态效率值维持较低水平的原因主要来自经济效益过低;②生态效率值在0.201~0.400区间的县域单元主要分布在张承地区和冀中南地区。位于张承地区的县域单元社会经济发展水平较低,产业结构层次偏低,多以资源密集型产业为主,例如农业等。因资源投入水平偏高,使得经济产出效率偏低,一定程度上拉低了生态效率水平。位于冀中南地区的县域单元社会经济发展水平相对较高,县域产业多以重化工为主,其特点是资源投入水平和期望经济效益产出差距较小,但在经济发展过程中产生了相对较高的非期望环境污染,生态效率值较低;③生态效率值在0.401~0.999区间的县域单元主要分布在区域核心、与中心城市的邻接地区。因其离中心城市较近,受到一定程度的辐射带动作用,城市经济发展规模较大,因此经济效益相对较高。但是,其产业结构仍然以第二产业为主,受生产技术水平等因素的影响,致使一定的资源投入产出了较高的非期望环境污染物,造成了生态效率损失;④生态效率值为1,即达到DEA前沿面的县域单元,具体包括区域核心京津唐市辖区以及迁安市、任丘市等。唐山市辖区经济发展起步早、工业基础雄厚,较高的资源投入产出了大量的期望经济效益,经济产出能力在一定程度上弥补了产出较高非期望环境污染物带来的生态效率损失。北京市辖区、天津市辖区、迁安市等单元则利用一定的资源投入产生了较高的经济效益,且污染产出呈降低趋势,资源投入、经济效益和环境影响三者间关系达到协调、高效的关系,表现出理想的可持续发展状态。
综上所述,从3个时期京津冀城市群县域生态效率空间格局总体概况来看,位于沿海及平原地区的核心城市市辖区及其周边县域单元的生态效率值普遍高于位于山区的县域单元生态效率值,中心城市辐射带动效应与自然本底条件对生态效率具有一定程度的影响。通过分析县域单元生态效率与资源投入、经济效益和环境影响指数的协调关系,发现经济发展越好的县域单元生态效率值越高的规律和存在一定的“中心—外围”现象。此外,县域单元生态效率值偏低的原因有2个:一是受一定资源投入下产出的经济效益偏低影响,包括冀西北和东南部分县域单元;二是因经济生产过程中排放的污染物对环境影响偏高,包括冀中南部分县域单元。
对2006、2010、2014年京津冀城市群内153个县域单元的全局自相关Moran's I指数值进行计算(表2),再对2006、2010和2014年的Moran's I指数经999次蒙特卡罗模拟,发现Moran's I指数在0.1%的显著水平上,3个时期都呈正的空间相关性,即生态效率高值集聚和低值集聚的空间特性。2006年以来,全局Moran's I指数依次为0.2539、0.3007、0.3088,呈出不断上升趋势,表明生态效率正向集聚现象逐渐增强。同时表明,各单元的生态效率不仅与该区域的经济发展水平等因素有关,还与周围邻域单元生态效率相关。
表2 2006-2014年京津冀城市群县域单元生态效率全局自相关Moran's I指数
Tab.2 Global spatial autocorrelation index of eco-efficiency in counties of the Beijing-Tianjin-Hebei Urban Agglomeration, 2006-2014
| 年份 | 2006年 | 2010年 | 2014年 |
|---|---|---|---|
| I | 0.2539 | 0.3007 | 0.3088 |
| E(I) | -0.0066 | -0.0067 | -0.0067 |
| Z(I) | 4.69 | 5.65 | 5.87 |
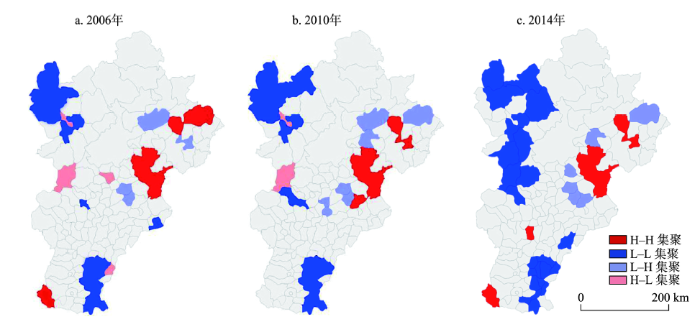
本文选用Moran散点图绘制LISA集聚图来描述效率局部空间异质性特征。根据县域单元生态效率在其相邻区域中的自相关性,可将其集聚类型分为4类:①第一类为“H-H”聚集区,县域单元自身和周边地区的生态效率值均较高,两者空间差异程度小;②第二类为“H-L”聚集区,县域单元自身生态效率较高,周边地区则较低,两者空间差异程度相对较大;③第三类为“L-L”聚集区,县域单元自身和周边地区的生态效率均较低,两者空间差异程度较小;④第四类为“L-H”聚集区,县域单元自身生态效率较低,周边地区较高,两者空间差异程度较大。结合Moran散点图和局部Moran's I指数,基于Geoda平台,绘制了2006、2010年和2014年京津冀城市群各县域单元生态效率的LISA集聚图(图5)。由图5可知,3个时期正相关模式(H-H、L-L关联模式)的县域单元数量呈上升趋势,表明京津冀城市群县域单元生态效率的正向集聚程度越来越显著。此外,自2006年以来,H-L关联区和L-H关联区的数量呈现出略有下降的态势,邻域单元生态效率差距有所缩减。
图5 2006年、2010年和2014年京津冀城市群县域单元生态效率的LISA集聚分布图
Fig.5 LISA cluster map of eco-efficiency in counties of the Beijing-Tianjin-Hebei Urban Agglomeration, 2006, 2010 and 2014
(1) H-H关联区。此类型区域主要集中在沿海和冀中南地区。自2006年开始,3个时期沿海地区的天津市辖区和迁西县正向集聚现象均显著,该区域所在的沿海区域是京津冀城市群中最大区位优势板块,也是带动城市群社会经济发展的增长极,形成一个显著的生态效率高值空间集聚区。位于天津西北部方向的青龙满族自治县则逐渐退出这一类型,变为L-H关联区,生态效率明显降低,成为高值区中的低谷。冀中南地区的H-H关联区则表现为一定的转移特征,2006年属于H-H关联区有冀南地区的涉县;2010年冀中南地区无H-H关联区域,2014年涉县以及冀中地区的晋州市进入这一类型。晋州市邻近有石家庄市辖区、辛集市等,涉县周边拥有邯郸市辖区、武安市辖区,这类区域是京津冀地区的次级中心区域,同样形成一个较显著的生态效率高值集聚区。
(2) H-L关联区。此类型区域空间分布格局比较稳定,随时间数量有所下降。2006年该类型主要集中在张家口市辖区、涞源县、高碑店市、清河县;2010年H-L关联区的城市主要有张家口市辖区、涞源县;2014年无该类型关联区。可以看出,自2006年开始,H-L关联区的数量开始减少,所有县域单元逐渐退出这一集聚区,涞源县则变为L-L关联类型。H-L关联区多位于重点生态功能区和农产品主产区,邻近单元经济发展水平均较低,自然本底及地理区位条件也不够优越。受此影响,该类关联区由原来自身生态效率较高、周边生态效率较低、空间差异大的地区变为自身和周边生态效率都比较低的生态效率低值集聚地。
(3) L-H关联区。此类型区域在3个研究时期内在空间上基本保持稳定,数量有所增加,主要包括京津唐周边县区。此类空间分布格局一定程度上说明京津唐市辖区发展过程中吸引了周边县区的投入要素,弱化了周边县区的经济发展,强大的“虹吸效应”加剧了周边县区L-H关联型格局,在一定程度上制约了区域生态效率的提升。但是,正因为此类型县域单元邻近经济比较发达的京津唐市辖区,具备了接受发达地区“扩散效应”辐射带动的先决条件,若加之合理的政策及发展规划的引导,该类型县域单元生态效率值提升潜力也较大。
(4) L-L关联区。这类区域在空间范围上呈连片连绵趋势,空间分布格局上基本保持稳定,主要集中在冀西北张家口地区、燕山山区、太行山山区以及冀西南部部分地区。这类关联区位于京津冀城市群边缘地区,发展基础薄弱,经济发展实力较差,再加上距离核心城市较远,社会经济发展有被边缘化趋势,与其相邻县域单元的生态效率值的差距在不断在放大。今后,应加大对L-L关联区产业扶持力度以及政策、资金支持,促使其加快融入京津冀城市群一体化发展的进程,从而减弱此类型县域单元生态低效率集聚趋势。
根据生态效率定义,资源投入与期望经济效益产出、非期望环境污染产出三者间的相互关系决定了区域生态效率的高低。本文通过设计资源投入—经济效益—环境影响复合生态效率评价指标体系,构建了京津冀城市群县域单元生态效率评价模型,对县域单元2006、2010、2014年资源投入、经济效益、环境影响及生态效率进行了分析评价。最后通过空间自相关分析方法,对生态效率的空间效应、关联模式进行了验证。主要结论如下:
(1) 资源投入高值区主要分布在京津唐三市及周边部分区域以及河北省沿海地区,包括秦皇岛及沧州市部分地区。资源投入低值区主要位于河北省北部及西南部地区。经济效益则呈现由沿海地区向内陆地区逐步递减趋势,基本格局随时间相对保持稳定。环境影响不同于资源投入和经济效益的空间格局,呈大范围、连片蔓延分布的空间特征。其中高值区主要分布在河北省沿海地区和冀中南地区,低值区则分布在河北省北部及西北部地区,与资源投入、经济效益的低值区格局保持一致。
(2) 从生态效率的计算结果、时空分异以及影响因素分析来看,京津冀城市群县域单元生态效率总体水平较低,均值分别为0.324、0.305、0.347,呈先下降后改善态势。京津冀城市群县域单元生态效率改善贡献最大的为0.200以下低值区的县域单元数量有所减少,生态效率有一定程度的提高。生态效率各分类区间空间格局分异明显,格局随时间变化相对稳定。从3个时期京津冀城市群县域生态效率总的概况来看,区位、自然本底条件是造成县域单元生态效率空间差异的主要原因,经济效益低和环境影响高则是制约生态效率提高的主要因素。
(3) 对3个时期京津冀城市群内153个县域单元的全局、局部空间自相关Moran's I指数值进行计算并进行检验,发现Moran's I指数在0.1%的显著水平上3个时期都呈正的空间相关性,高值与低值集聚具有逐渐增强趋势。说明各单元的生态效率不仅与该区域的社会经济发展水平等因素有关,还与周围邻域单元生态效率相关。此外,自2006年以来,H-L关联区和L-H关联区的数量呈略有下降的态势,邻域单元生态效率差距有所缩小。
综上所述,本文认为在以下3个方面的政策导向将有利于提升京津冀城市群县域单元生态效率:①加强京津唐市辖区对周边以及沿海县域的辐射带动作用,加快人力、资本、技术等要素的外溢速度,强化周边及沿海县域要素集聚能力,推动产业结构向高端、高效、高附加值的战略新兴产业转变。进一步提高这些地区的经济效益是提升京津冀城市群整体生态效率的有效途径。②冀中南地区应整合科技创新资源,促进生产工艺水平提升,加快传统产业的转型升级,严格控制重化工业产能,降低生产过程中大气污染物的排放强度。此外,县域间应强化生态建设和环境保护力度,建立生态同建、环境同治的联防联控生态环境保护机制。弱化这些地区的环境影响是提升地区生态效率的关键。③冀西北和东南部地区应在巩固生态建设和环境保护已有成果基础上,控制经济开发强度,优化开发方式,加强产业集聚区建设,完善产业链布局,推动生态产业发展,提高经济效益,最终实现生态效率的提升。
The authors have declared that no competing interests exist.
| [1] |
特大城市群地区城镇化与生态环境交互耦合效应解析的理论框架及技术路径 [J].https://doi.org/10.11821/dlxb201604001 URL [本文引用: 1] 摘要
特大城市群地区是国家经济发展的战略核心区和国家新型城镇化的主体区,担当着世界经济重心转移承载地的历史重任,但在发展过程中面临着日益严重的资源与生态环境的胁迫压力。开展特大城市群地区城镇化与生态环境交互耦合效应的研究,是未来10年地球系统科学研究的前沿领域和高优先研究主题。本文系统解析了特大城市群地区城镇化与生态环境交互耦合效应的基本理论框架。首先从理论上分析了特大城市群系统各自然要素和人文要素交互作用的非线性耦合关系及耦合特征,科学辨识近远程主控要素作用下城市群系统内外部各要素相互作用的胁迫强度、近远程耦合机理与规律,总结特大城市群地区城镇化与生态环境交互耦合圈理论,进一步构建多要素—多尺度—多情景—多模块—多智能体集成的时空耦合动力学模型,研发特大城市群地区可持续发展优化智能调控决策支持系统;其次从方法上将特大城市群地区视为一个开放的复杂巨系统,在建立同一标准化共享数据库的基础上,采用多要素—多目标—多模型—多情景环境下的城镇化与生态环境交互耦合集成技术方法、大数据支持下的城镇化与生态环境交互耦合技术方法,构建多尺度—多技术—多智能体集成的城镇化与生态环境交互耦合技术框架,按照分析时空演变特征—寻求主控要素—辨识耦合关系—揭示胁迫机制—发现耦合规律—筛选调控变量—求解临界阈值—进行调控试验—完成情景模拟—提出优化方案—完成情景模拟—提出优化方案—实现国家目标这样一条技术路径,提出解决问题的整体优化方案。本文旨在为特大城市群地区由问题集中区转为可持续发展区提供理论指导和方法支撑。
Theoretical analysis of interactive coupled effects between urbanization and eco-environment in mega-urban agglomerations [J].https://doi.org/10.11821/dlxb201604001 URL [本文引用: 1] 摘要
特大城市群地区是国家经济发展的战略核心区和国家新型城镇化的主体区,担当着世界经济重心转移承载地的历史重任,但在发展过程中面临着日益严重的资源与生态环境的胁迫压力。开展特大城市群地区城镇化与生态环境交互耦合效应的研究,是未来10年地球系统科学研究的前沿领域和高优先研究主题。本文系统解析了特大城市群地区城镇化与生态环境交互耦合效应的基本理论框架。首先从理论上分析了特大城市群系统各自然要素和人文要素交互作用的非线性耦合关系及耦合特征,科学辨识近远程主控要素作用下城市群系统内外部各要素相互作用的胁迫强度、近远程耦合机理与规律,总结特大城市群地区城镇化与生态环境交互耦合圈理论,进一步构建多要素—多尺度—多情景—多模块—多智能体集成的时空耦合动力学模型,研发特大城市群地区可持续发展优化智能调控决策支持系统;其次从方法上将特大城市群地区视为一个开放的复杂巨系统,在建立同一标准化共享数据库的基础上,采用多要素—多目标—多模型—多情景环境下的城镇化与生态环境交互耦合集成技术方法、大数据支持下的城镇化与生态环境交互耦合技术方法,构建多尺度—多技术—多智能体集成的城镇化与生态环境交互耦合技术框架,按照分析时空演变特征—寻求主控要素—辨识耦合关系—揭示胁迫机制—发现耦合规律—筛选调控变量—求解临界阈值—进行调控试验—完成情景模拟—提出优化方案—完成情景模拟—提出优化方案—实现国家目标这样一条技术路径,提出解决问题的整体优化方案。本文旨在为特大城市群地区由问题集中区转为可持续发展区提供理论指导和方法支撑。
|
| [2] |
中国能源生态效率的空间格局与空间效应 [J].https://doi.org/10.11821/dlxb201506011 Magsci 摘要
<p>能源生态效率兼顾能源利用中的生态效益与经济效益,是对能源—环境—经济3E系统效率的度量。基于考虑非期望产出的SBM模型对中国1997-2012年省际能源生态效率进行测度,从空间格局规模、格局强度与格局纹理三个方面分析能源生态效率的空间分布特征和演变规律,运用空间计量模型验证中国省际能源生态效率的空间溢出效应及其影响因素。研究表明:① 中国能源生态效率整体偏低,低效率省份约占40%,广东、海南、福建位于能源生态效率值的最前沿,宁夏、甘肃、青海、新疆为主要的低能效地区。全国能源生态效率总体上呈U型演变格局,局部地区主要有增长型、波动型、突变型和平稳型等4种演变类型;② 中国能源生态效率在省际尺度上表现出显著的全局与局部空间集聚特征,高高集聚区主要分布在东部沿海和南部沿海地区,低低集聚区主要分布在西北地区和黄河中游地区。空间格局的变化主要发生在高低集聚区与低高集聚区,其中又以京津冀地区的集聚类型演变最为显著;③ 中国能源生态效率存在着明显的空间效应,某一地区的能源生态效率对相邻地区的空间溢出程度均强于相邻地区的误差冲击对该地区的影响程度;在影响能源生态效率空间效应的诸多因素中,产业结构的影响最大。</p>
Study on spatial pattern and spatial effect of energy eco-efficiency in China [J].https://doi.org/10.11821/dlxb201506011 Magsci 摘要
<p>能源生态效率兼顾能源利用中的生态效益与经济效益,是对能源—环境—经济3E系统效率的度量。基于考虑非期望产出的SBM模型对中国1997-2012年省际能源生态效率进行测度,从空间格局规模、格局强度与格局纹理三个方面分析能源生态效率的空间分布特征和演变规律,运用空间计量模型验证中国省际能源生态效率的空间溢出效应及其影响因素。研究表明:① 中国能源生态效率整体偏低,低效率省份约占40%,广东、海南、福建位于能源生态效率值的最前沿,宁夏、甘肃、青海、新疆为主要的低能效地区。全国能源生态效率总体上呈U型演变格局,局部地区主要有增长型、波动型、突变型和平稳型等4种演变类型;② 中国能源生态效率在省际尺度上表现出显著的全局与局部空间集聚特征,高高集聚区主要分布在东部沿海和南部沿海地区,低低集聚区主要分布在西北地区和黄河中游地区。空间格局的变化主要发生在高低集聚区与低高集聚区,其中又以京津冀地区的集聚类型演变最为显著;③ 中国能源生态效率存在着明显的空间效应,某一地区的能源生态效率对相邻地区的空间溢出程度均强于相邻地区的误差冲击对该地区的影响程度;在影响能源生态效率空间效应的诸多因素中,产业结构的影响最大。</p>
|
| [3] |
基于生态效率的辽宁省循环经济分析 [J].
生态效率与循环经济相辅相成。基于区域生态效率评价是考量区域循环经济的重要内容,又基于目前对于循环经济与生态效率结合的实证研究相对较少,因此,以生态效率理论为基础,对我国最早开展循环经济的试点省份--辽宁省的循环经济发展作以综合衡量。通过生态效率度量模型与循环经济度量模型,以辽宁省1990-2008年数据为基础,运用基于熵权的TOPSIS方法,分别计算了19a间辽宁省各年的资源效率、环境效率、生态效率,进而综合评价了辽宁省循环经济发展轨迹。研究表明:在19a间,辽宁省生态效率总体呈现波动上升态势,经历了传统经济发展模式-末端治理模式-循环经济模式的转变;19a间,辽宁省循环经济发展状态总体上处于循环性不断增强的状态,即经济发展的同时,环境压力不断减小。研究证明了辽宁省2002年实行循环经济以来取得了明显成效,对全国尤其是东北地区发展循环经济,走新型工业化道路具有重要的示范意义。
Analysis of circular economy of Liaoning Province based on eco-efficiency [J].
生态效率与循环经济相辅相成。基于区域生态效率评价是考量区域循环经济的重要内容,又基于目前对于循环经济与生态效率结合的实证研究相对较少,因此,以生态效率理论为基础,对我国最早开展循环经济的试点省份--辽宁省的循环经济发展作以综合衡量。通过生态效率度量模型与循环经济度量模型,以辽宁省1990-2008年数据为基础,运用基于熵权的TOPSIS方法,分别计算了19a间辽宁省各年的资源效率、环境效率、生态效率,进而综合评价了辽宁省循环经济发展轨迹。研究表明:在19a间,辽宁省生态效率总体呈现波动上升态势,经历了传统经济发展模式-末端治理模式-循环经济模式的转变;19a间,辽宁省循环经济发展状态总体上处于循环性不断增强的状态,即经济发展的同时,环境压力不断减小。研究证明了辽宁省2002年实行循环经济以来取得了明显成效,对全国尤其是东北地区发展循环经济,走新型工业化道路具有重要的示范意义。
|
| [4] |
中国生态效率测度与空间差异实证: 基于SBM模型与空间自相关性的分析 [J].https://doi.org/10.13448/j.cnki.jalre.2016.173 URL 摘要
采用非期望产出SBM模型对中国生态效率进行测度,运用空间自相关分析法分析了中国生态效率全局及局域的空间差异。结果表明:1)2004~2012年中国生态效率呈现"W"型的波动中缓慢上升态势,中国生态效率均值为0.546,处于较低水平,30个省市中只有东部沿海地区的北京、天津、江苏、山东、福建、广东、浙江7个省的生态效率一直处于有效前沿,中南部省份的生态效率增长幅度较大,而位于西北部省份的生态效率增长缓慢甚至处于停滞状态;2)从全局来看,中国生态效率相似水平的区域在空间上表现出波动性的集聚现象,从局域来看,由于受到东部高生态效率区的积极辐射作用,中国生态效率在不断提高的同时原有的区域极化形势得到改善、区域差异性得到缩小。
The measure and the spatial disparity analysis of eco-efficiency in China [J].https://doi.org/10.13448/j.cnki.jalre.2016.173 URL 摘要
采用非期望产出SBM模型对中国生态效率进行测度,运用空间自相关分析法分析了中国生态效率全局及局域的空间差异。结果表明:1)2004~2012年中国生态效率呈现"W"型的波动中缓慢上升态势,中国生态效率均值为0.546,处于较低水平,30个省市中只有东部沿海地区的北京、天津、江苏、山东、福建、广东、浙江7个省的生态效率一直处于有效前沿,中南部省份的生态效率增长幅度较大,而位于西北部省份的生态效率增长缓慢甚至处于停滞状态;2)从全局来看,中国生态效率相似水平的区域在空间上表现出波动性的集聚现象,从局域来看,由于受到东部高生态效率区的积极辐射作用,中国生态效率在不断提高的同时原有的区域极化形势得到改善、区域差异性得到缩小。
|
| [5] |
资源型城市的生态效率评价 [J].
为深入把握资源型城市循环经济发展状况,本文引入生态效率概念,并用因子分析法测算了我国16座资源型城市2007年的生态效率,发现城市间的生态效率差异很大,最高值是最低值的3.9倍;资源型城市的生态效率值按煤炭类、金属类、综合类、石油类的顺序逐渐降低,煤炭类城市的生态效率是石油类城市的1.9倍,资源类型对城市的生态效率值影响较大,而且同一类型的资源型城市生态效率差别也较大,资源型城市所处的地理位置与规模对生态效率也有影响,但年龄对生态效率的影响较小,另外还发现居民的生活习惯与消费方式对城市的生态效率也有影响。
Assessment for eco-efficiency of resource-based cities [J].
为深入把握资源型城市循环经济发展状况,本文引入生态效率概念,并用因子分析法测算了我国16座资源型城市2007年的生态效率,发现城市间的生态效率差异很大,最高值是最低值的3.9倍;资源型城市的生态效率值按煤炭类、金属类、综合类、石油类的顺序逐渐降低,煤炭类城市的生态效率是石油类城市的1.9倍,资源类型对城市的生态效率值影响较大,而且同一类型的资源型城市生态效率差别也较大,资源型城市所处的地理位置与规模对生态效率也有影响,但年龄对生态效率的影响较小,另外还发现居民的生活习惯与消费方式对城市的生态效率也有影响。
|
| [6] |
京津冀城市群功能定位及协同发展 [J].
本文回顾了京津冀大城市群内部各组成部分的经济联系与利益矛盾。阐述了改革开放以来,京津两市和河北省的经济发展特点及已形成的优势。根据各自的特点、优势和符合国家战略利益的原则,提出了京津冀大城市群中北京、天津、河北省的功能定位。
Function orientation and coordinating development of subregions within the Jing-Jin-Ji Urban Agglomeration [J].
本文回顾了京津冀大城市群内部各组成部分的经济联系与利益矛盾。阐述了改革开放以来,京津两市和河北省的经济发展特点及已形成的优势。根据各自的特点、优势和符合国家战略利益的原则,提出了京津冀大城市群中北京、天津、河北省的功能定位。
|
| [7] |
基于熵权-TOPSIS的山区乡镇通达性研究: 以重庆市石柱县为例 [J].https://doi.org/10.18306/dlkxjz.2016.09.009 URL [本文引用: 1] 摘要
交通是支撑区域经济社会发展的基础之一,通达性则是反映交通设施水平的有效评价指标。本文以重庆市石柱县为例,选取空间数据和调研数据,引入熵权-TOPSIS模型构建集内外通达性和摩擦阻抗于一体的指标体系,客观分析山区乡镇的通达性,以期为交通合理规划提供参考。结果表明:(1)通达性指标对区域综合通达性影响程度为:交通设施技术(C_4)摩擦阻抗(C_5)等效道路密度(C_2)乡镇内部连通度(C_1)与省干道衔接度(C_3)。(2)贴近度变异系数达0.5410,说明样区交通通达性水平空间差异大。(3)通达性空间格局表现出以南宾、西沱、悦崃为极核点向外围扩散递减趋势;通达性空间分布表现为西高东低,高通达区主要分布在平缓区,低通达区主要分布在陡峭山区。(4)通达性良好区域呈"一环一轴"模式分布,呈显著主干道指向性。(5)样区乡镇通达性空间分布格局与经济发展水平和土地流转面积有较高趋同性。研究结果能为区域协调发展、交通合理规划提供良好的理论与实践指导。
Rural transportation accessibility in mountainous areas based on the entropy-weight TOPSIS method: A case study of Shizhu County, Chongqing Municipality [J].https://doi.org/10.18306/dlkxjz.2016.09.009 URL [本文引用: 1] 摘要
交通是支撑区域经济社会发展的基础之一,通达性则是反映交通设施水平的有效评价指标。本文以重庆市石柱县为例,选取空间数据和调研数据,引入熵权-TOPSIS模型构建集内外通达性和摩擦阻抗于一体的指标体系,客观分析山区乡镇的通达性,以期为交通合理规划提供参考。结果表明:(1)通达性指标对区域综合通达性影响程度为:交通设施技术(C_4)摩擦阻抗(C_5)等效道路密度(C_2)乡镇内部连通度(C_1)与省干道衔接度(C_3)。(2)贴近度变异系数达0.5410,说明样区交通通达性水平空间差异大。(3)通达性空间格局表现出以南宾、西沱、悦崃为极核点向外围扩散递减趋势;通达性空间分布表现为西高东低,高通达区主要分布在平缓区,低通达区主要分布在陡峭山区。(4)通达性良好区域呈"一环一轴"模式分布,呈显著主干道指向性。(5)样区乡镇通达性空间分布格局与经济发展水平和土地流转面积有较高趋同性。研究结果能为区域协调发展、交通合理规划提供良好的理论与实践指导。
|
| [8] |
中国农业生态效率评价方法与实证: 基于非期望产出的SBM模型分析 [J].https://doi.org/10.5846/stxb201207080953 Magsci 摘要
生态效率是衡量经济与资源环境协调发展的重要指标。基于将农业面源污染作为非期望产出的考量,在对传统DEA模型进行修正的基础上,采用非径向、非角度的SBM模型对中国30个省份的农业生态效率进行了测算,并给出了农业生态效率的改善途径。研究结果表明:1998-2009年中国农业生态效率虽然呈现缓慢上升态势,但整体仍处于较低水平,除北京、上海、海南、重庆外,其余省市都需要改变投入和产出来优化农业生态效率;资源的过度消耗和环境污染物的过量排放是农业生态效率损失的主要原因。提高资源利用效率、降低资源消耗量和环境污染物的排放量是农业生态效率改善的重要途径。
Agricultural eco-efficiency evaluation in China based on SBM model [J].https://doi.org/10.5846/stxb201207080953 Magsci 摘要
生态效率是衡量经济与资源环境协调发展的重要指标。基于将农业面源污染作为非期望产出的考量,在对传统DEA模型进行修正的基础上,采用非径向、非角度的SBM模型对中国30个省份的农业生态效率进行了测算,并给出了农业生态效率的改善途径。研究结果表明:1998-2009年中国农业生态效率虽然呈现缓慢上升态势,但整体仍处于较低水平,除北京、上海、海南、重庆外,其余省市都需要改变投入和产出来优化农业生态效率;资源的过度消耗和环境污染物的过量排放是农业生态效率损失的主要原因。提高资源利用效率、降低资源消耗量和环境污染物的排放量是农业生态效率改善的重要途径。
|
| [9] |
考虑能源、环境因素的中国工业效率评价: 基于SBM模型的省级数据分析 [J].Efficiency evaluation of industrial sectors in China accounting for the energy and environment factors: Based on provincial data by a SBM approach [J]. |
| [10] |
Power industry restructuring and eco-efficiency changes: A new slacks-based model in Malmquist-Luenberger index measurement [J].https://doi.org/10.1016/j.enpol.2014.01.016 URL [本文引用: 1] 摘要
Measuring variations in efficiency and its extension, eco-efficiency, during a restructuring period in different industries has always been a point of interest for regulators and policy makers. This paper assesses the impacts of restructuring of procurement in the Iranian power industry on the performance of power plants. We introduce a new slacks-based model for Malmquist–Luenberger (ML) Index measurement and apply it to the power plants to calculate the efficiency, eco-efficiency, and technological changes over the 8-year period (2003–2010) of restructuring in the power industry. The results reveal that although the restructuring had different effects on the individual power plants, the overall growth in the eco-efficiency of the sector was mainly due to advances in pure technology. We also assess the correlation between efficiency and eco-efficiency of the power plants, which indicates a close relationship between these two steps, thus lending support to the incorporation of environmental factors in efficiency analysis.
|
| [11] |
Multifunctional ecological footprint analysis for assessing eco-efficiency: A case study of fruit production systems in Northern Italy [J].https://doi.org/10.1016/j.jclepro.2012.09.028 URL Magsci [本文引用: 1] 摘要
Sustainable farming in the fruit production systems of the Piemonte Region of Northern Italy was examined using a multifunctional Ecological Footprint based method. The analysis is based on the quantification of four different ecological footprint applications related to different functional units: tons of product, nutrient content in the fruit produced, hectare of crop and 1000(sic) of revenue. Of the major fruit production in the region, apricot and nectarine show the best overall performance from an ecological and economic point of view. This result is mainly due to the low input requirements of the cultivation processes, combined with a good product mass and the high market value of the fruit. Kiwifruit production had the worst overall ranking due to the high requirement of agronomical inputs and a low market value of the final product. The problems and the key aspects of a multifunctional assessment are discussed from a methodological point of view. The results highlight that standard Ecological Footprint Analysis alone does not allow for the complete evaluation of the environmental profile of different production systems. (c) 2012 Elsevier Ltd. All rights reserved.
|
| [12] |
Eco-efficiency indicators: Measuring resource-use efficiency and the impact of economic activities on the environment [C]// |
| [13] |
Transportation related carbon, energy and water footprint analysis of U.S. manufacturing: An eco-efficiency assessment [J].https://doi.org/10.1016/j.trd.2014.07.001 URL [本文引用: 1] 摘要
In this paper, two-step hierarchical methodology is utilized to quantify the transportation related carbon, energy and water footprint (FP) of nation鈥檚 manufacturing sectors and evaluate the environmental vs. economic performance based on eco-efficiency scores. The methodology consists of an integrated application of the economic input output life cycle assessment (EIO-LCA) and Data Envelopment Analysis (DEA) approaches. In the first phase, EIO-LCA is employed to quantify the environmental impacts associated with the activities between 276 manufacturing sectors and the transportation industry and the second phase compares the overall environmental impact vs. economic benefit tradeoff by determining the eco-efficiency value of each sector. Results of EIO-LCA indicated that food manufacturing is found to be as the major driver of carbon, energy and water FP categories with an approximate share of 22% of the total impact on freight transportation activities in the transportation industry. Additionally, based on DEA-based sustainability performance assessment results, vast majority of U.S. manufacturing sectors were found to be inefficient (eco-efficiency <1). Only tobacco manufacturing was found to be eco-efficient among 53 major manufacturing sectors and the U.S. average was obtained as 0.5. Results indicated that inefficient U.S. manufacturing sectors need to reach an average reduction of 50% on the carbon, energy and water FP impacts to reach the 100% eco-efficiency frontier. Additionally, the weight of the transported goods was incorporated into the economic output as $/ton-km carriage, which yielded highly correlated results with the initial assessment based on total economic output only.
|
| [14] |
LCI modelling approaches applied on recycling of materials in view of environmental sustainability, risk perception and eco-efficiency [J].https://doi.org/10.1007/s11367-010-0201-6 URL [本文引用: 1] 摘要
Two ISO-compliant approaches on modelling the recycling of plastics and metals are frequently applied in life cycle assessment case studies and intensively debated: the recycled content or cutoff appr
|
| [15] |
Long-term trends worldwide in ambient NO2 concentrations inferred from satellite observations [J].
Introduction Globally, > 3 million premature deaths were attributed to ambient air quality...
|
| [16] |
Application of material flow analysis to estimate the efficiency of e-waste management systems: The case of Lithuania [J].https://doi.org/10.1177/0734242X11406171 URL PMID: 21652624 Magsci [本文引用: 1] 摘要
Electrical and electronic equipment (EEE) has penetrated everyday life. The EEE industry is characterized by a rapid technological change which in turn prompts consumers to replace EEE in order to keep in step with innovations. These factors reduce an EEE life span and determine the exponential growth of the amount of obsolete EEE as well as EEE waste (e-waste). E-waste management systems implemented in countries of the European Union (EU) are not able to cope with the e-waste problem properly, especially in the new EU member countries. The analysis of particular e-waste management systems is essential in evaluation of the complexity of these systems, describing and quantifying the flows of goods throughout the system, and all the actors involved in it. The aim of this paper is to present the research on the regional agent based material flow analysis in e-waste management systems, as a measure to reveal the potential points for improvement. Material flow analysis has been performed as a flow of goods (EEE). The study has shown that agent-based EEE flow analysis incorporating a holistic and life cycle thinking approach in national e-waste management systems gives a broader view to the system than a common administrative one used to cover. It helps to evaluate the real efficiency of e-waste management systems and to identify relevant impact factors determining the current operation of the system.
|
| [17] |
Opportunity cost based analysis of corporate eco-efficiency: A methodology and its application to the CO2-efficiency of German companies [J].https://doi.org/10.1016/j.jenvman.2010.05.004 URL PMID: 20570034 [本文引用: 1] 摘要
In this paper, we propose the return-to-cost-ratio (RCR) as an alternative approach to the analysis of operational eco-efficiency of companies based on the notion of opportunity costs. RCR helps to overcome two fundamental deficits of existing approaches to eco-efficiency. (1) It translates eco-efficiency into managerial terms by applying the well-established notion of opportunity costs to eco-efficiency analysis. (2) RCR allows to identify and quantify the drivers behind changes in corporate eco-efficiency. RCR is applied to the analysis of the CO(2)-efficiency of German companies in order to illustrate its usefulness for a detailed analysis of changes in corporate eco-efficiency as well as for the development of effective environmental strategies.
|
| [18] |
A comprehensive eco-efficiency model and dynamics of regional eco-efficiency in China [J].https://doi.org/10.1016/j.jclepro.2013.12.003 URL Magsci [本文引用: 1] 摘要
In order to have a comprehensive eco-efficiency measure which can incorporate productivity, resource efficiency, environmental efficiency, and inter-temporal comparability and circularity, the paper proposes an extended data envelopment analysis model, named GB-US-SBM model, which combines global benchmark technology, undesirable output, super efficiency and slacks-based measure. Using the GB-US-SBM model, this paper investigates the dynamics of regional eco-efficiency in China from 2000 to 2010. The empirical results show that the movement of average eco-efficiency of China presents a "V" shape from 2000 to 2010 with the trough occurred in 2005, but there are big differences of eco-efficiency among the regions. For the growth of eco-efficiency, technological progress contributes 56.87%, 58.21%, 18.27%, 62.19%; scale efficiency contributes 40.01%, 61.14%, 167.43%, 39.12%; efficiency change contributes 3.82%, -19.99%, -63.40%, -2.16% to the eastern, middle, western and northeastern regions of China respectively. These imply that there is a big space for western region to enhance its technological progress, and huge space for the whole country to promote its management ability. (C) 2013 Elsevier Ltd. All rights reserved.
|
| [19] |
A framework for quantified eco-efficiency analysis [J].https://doi.org/10.1162/108819805775247882 URL [本文引用: 1] 摘要
Eco‐efficiency is an instrument for sustainability analysis, indicating an empirical relation in economic activities between environmental cost or value and environmental impact. This empirical relation can be matched against normative considerations as to how much environmental quality or improvement society would like to offer in exchange for economic welfare, or what the trade‐off between the economy and the environment should be if society is to realize a certain level of environmental quality. Its relevance lies in the fact that relations between economy and environment are not self‐evident, not at a micro level and not at the macro level resulting from micro‐level decisions for society as a whole. Clarifying the why and what of eco‐efficiency is a first step toward decision support on these two aspects of sustainability. With the main analytic framework established, filling in the actual economic and environmental relations requires further choices in modeling. Also, the integration of different environmental effects into a single score requires a clear definition of approach, because several partly overlapping methods exist. Some scaling problems accompany the specification of numerator and denominator, which need a solution and some standardization before eco‐efficiency analysis can become more widely used. With a method established, the final decision is how to embed it in practical decision making. In getting the details of eco‐efficiency better specified, its strengths, but also its weaknesses and limitations, need to be indicated more clearly.
|
| [20] |
An emergy analysis-based methodology for eco-efficiency evaluation of building manufacturing [J].https://doi.org/10.1016/j.ecolind.2011.03.004 Magsci [本文引用: 1] 摘要
Building manufacturing creates product value like building space, and induces severe environmental influence at the same time. The idea of eco-efficiency (EE) can link a product or service value and the corresponding environmental influence together, but there has been little research that implements such idea on building manufacturing, such as the green building rating system of the comprehensive assessment system for building environmental efficiency (CASBEE) in Japan and the EcoEffect in Sweden. This paper proposes an emergy (spelled with an "m") analysis-based methodology for EE evaluation of building manufacturing, where the building space (in cubic size) and the emergy amount of building manufacturing are selected as the indicators of product value and the environmental influence, respectively. Six residential buildings that include multi-storeys, moderate high-rises and high rises are selected averagely from two Chinese famous cities, namely Beijing and Shanghai. The evaluation results can provide directions to assess environmental influence and thus to heighten the EE of building manufacturing. The EE evaluation result can even be used as the base of a new green building (or eco-building) rating system. (C) 2011 Elsevier Ltd. All rights reserved.
|
| [21] |
The effect of economic growth, urbanization, and industrialization on fine particulate matter (PM2.5) concentrations in China [J].https://doi.org/10.1021/acs.est.6b02562 URL PMID: 27709931 [本文引用: 1] 摘要
Rapid economic growth, industrialization, and urbanization in China has led to extremely severe air pollution that causes increasing negative effects on human health, visibility, and climate change. However, the influence mechanisms of these anthropogenic factors on fine particulate matter (PM2.5) concentrations are poorly understood. In this study, we combined panel data and econometric methods to investigate the main anthropogenic factors that contribute to increasing PM2.5 concentrations in China at the prefecture level from 1999 to 2011. The results showed that PM2.5 concentrations and three anthropogenic factors were cointegrated. The panel Fully Modified Least Squares and panel Granger causality test results indicated economic growth, industrialization, and urbanization increases PM2.5 concentrations in the long run. The results implied that if China persists in its current development pattern, economic growth, industrialization and urbanization will inevitably lead to increased PM2.5 emissions in t...
|
| [22] |
An eco-efficiency-based urban sustainability assessment method and its application [J].https://doi.org/10.1080/13504509.2010.493070 URL [本文引用: 1] 摘要
ABSTRACT It is of critical importance to develop appropriate assessment tools with which to comprehensively measure the sustainability status of a region in order to guide its transformation to sustainable development. This paper proposes a novel method of sustainability assessment based on urban eco-efficiency, which calculates the ratios of welfare and ecological impact. This method can demonstrate the relative sustainability status of targeted regions for different time periods, and it implicitly considers comprehensive urban information including ecology, economy and society. By using the human development index (HDI) and ecological footprint (EF) as measures of urban welfare and ecological burden, we carried out a case study of Xiamen City during 2000鈥2006 using the proposed method. The results indicated that there is a fluctuation of eco-efficiency, which shows a steady increase then a sharp decline, with a marginal increase towards the end of the studied period. Overall, eco-efficiency, resource efficiency and environmental efficiency declined 0.155-, 0.157- and 0.153-times, respectively, during this period. This means that the increase of ecological consumption is faster than improvement of social welfare. As a result, urban sustainability declines, and its future increase depend on improvements of both resource and environment efficiency. Our method proved effective in analysing the relative sustainability status among targeted regions for different time periods, paving the way for practical applications, such as policy analysis, in pursuit of sustainable development.
|
| [23] |
Eco-efficiency of urban material metabolism: A case study in Xiamen, China [J].https://doi.org/10.1080/13504501003603223 URL [本文引用: 1] 摘要
Abstract In this research, the data envelopment analysis (DEA) model of measuring the eco-efficiency of urban material metabolism has been constructed based on the urban material input and output indicators. According to the data of Xiamen from 1985 to 2007, an empirical study was conducted to measure the eco-efficiency of urban material metabolism using DEA program. The results showed a general downtrend of Xiamen's eco-efficiency of material metabolism from 1985 to 2007, in which there were 15 efficient years and eight inefficient years. The eco-efficiency and urbanization rate of Xiamen was remarkably negatively correlated. Moreover, the results revealed at 4 years (1995, 2001, 2002 and 2003) there had been undesirable output slack (environmental pollution), and at 2 years (1991 and 1999) there had been desirable output slack (GDP), and at 8 years there had been input slack (water, land, food and energy), especially for water and energy. Finally, some suggestions on promoting the eco-efficiency of urban material metabolism were put forward.
|
| [24] |
From strategic goals to focused eco-efficiency improvement in production-bridging the gap using environmental value stream mapping [C]// |
| [25] |
An analysis of the eco-efficiency of remanufactured personal computers and mobile phones [J]. |
| [26] |
Eco-efficiency in corporate budgeting [J].https://doi.org/10.1108/09566160110389924 URL 摘要
ABSTRACT Any measure of eco-efficiency requires financial information, for calculating the numerator, and physical information about the environment, for calculating the denominator. Accounting and finance staff provide key financial information about the numerator in eco-efficiency calculations. Hence, for eco-efficiency measures to be calculated and for the measures to add value it is essential for them to be integrated with accounting and financial management processes such as budgetary control. Calculating measures of eco-efficiency is not enough on its own to ensure corporate value is added. Accounting and finance staff have to be involved in the planning of future long-term eco-efficiency improvement. If value added from continuous improvement in eco-efficiency activities is to be anticipated it is necessary for eco-efficiency and budgeting to be integrated. The paper provides some conceptual and practical guidance to help managers achieve this integration. Recently a number of companies have suggested that corporate budgeting no longer serves a purpose in their organizations (e.g. in network organizations). By demonstrating that, if information related to the neglect of potential environmental protection activities is ignored, the costs to business can be very high, this suggested change in practice is considered. It is concluded that a set of contingent guidelines need to be developed for budgeted eco-efficiency situations to help management and regulators assess value-added opportunities from using this new environmental management tool.
|
| [27] |
A slacks-based measure of efficiency in data envelopment analysis [J].https://doi.org/10.1016/S0377-2217(99)00407-5 Magsci 摘要
<p id="">In this paper, we will propose a slacks-based measure (SBM) of efficiency in Data Envelopment Analysis (DEA). This scalar measure deals directly with the input excesses and the output shortfalls of the decision making unit (DMU) concerned. It is units invariant and monotone decreasing with respect to input excess and output shortfall. Furthermore, this measure is determined only by consulting the reference-set of the DMU and is not affected by statistics over the whole data set. The new measure has a close connection with other measures proposed so far, e.g., Charnes–Cooper–Rhodes (CCR), Banker–Charnes–Cooper (BCC) and the Russell measure of efficiency. The dual side of this model can be interpreted as profit maximization, in contrast to the ratio maximization of the CCR model. Numerical experiments show its validity as an efficiency measurement tool and its compatibility with other measures of efficiency.</p>
|
| [28] |
Global estimates of fine particulate matter using a combined geophysical-statistical method with information from satellites, models, and monitors [J].https://doi.org/10.1021/acs.est.5b05833 URL PMID: 26953851 [本文引用: 1] 摘要
We estimated global fine particulate matter (PM2.5) concentrations using information from satellite-, simulation- and monitor-based sources by applying a Geographically Weighted Regression (GWR) to global geophysically based satellite-derived PM2.5 estimates. Aerosol optical depth from multiple satellite products (MISR, MODIS Dark Target, MODIS and SeaWiFS Deep Blue, and MODIS MAIAC) was combined with simulation (GEOS-Chem) based upon their relative uncertainties as determined using ground-based sun photometer (AERONET) observations for 1998-2014. The GWR predictors included simulated aerosol composition and land use information. The resultant PM2.5 estimates were highly consistent (R2=0.81) with out-of-sample cross-validated PM2.5 concentrations from monitors. The global population-weighted annual average PM2.5 concentrations were three-fold higher than the 10 渭g/m3 WHO guideline, driven by exposures in Asian and African regions. Estimates in regions with high contributions from mineral dust were associated with higher uncertainty, resulting from both sparse ground-based monitoring, and challenging conditions for retrieval and simulation. This approach demonstrates that the addition of even sparse ground-based measurements to more globally continuous PM2.5 data sources can yield valuable improvements to PM2.5 characterization on a global scale.
|
| [29] |
Expand the frontiers of urban sustainability [J].https://doi.org/10.1038/536391a URL PMID: 27558049 [本文引用: 1] 摘要
Social equity and global impacts are missing from measures of cities' environmental friendliness, write David Wachsmuth, Daniel Aldana Cohen and Hillary Angelo.
|
| [30] |
Using eco-efficiency as an indicator for sustainable urban development: A case study of Chinese provincial capital cities [J].https://doi.org/10.1016/j.ecolind.2013.09.003 URL Magsci [本文引用: 2] 摘要
Urbanisation in China has resulted in an increased consumption of resources, energy and materials and led to negative environmental effects. All of these factors have motivated the widely discussed topic of urban sustainable development in China. The core of this discussion is how to quantitatively measure urban sustainable development. This research uses eco-efficiency as an indicator to measure urban sustainable development. A data envelopment analysis model was applied to eco-efficiency analysis using environmental pollution as an undesirable output, and a super-efficiency model was modified for ranking. Using real datum for 30 Chinese provincial capital cities, an empirical study was employed to describe their eco-efficiency. The results show that: almost half of the cities are fairly eco-efficient. The inefficient cities are mainly located in the southwest and northwest of China, which are the undeveloped economic zones, while some of the eco-efficient cities have more environmental pollution and consume more land, energy and water. When ranking cities using a modified model, it was found that Haikou, Fuzhou and Beijing were the top three most eco-efficient cities, while Yinchuan, Lanzhou, Guiyang were the bottom three. When exploring the driving force of eco-efficiency, this paper proposes changing the GDP-oriented growth model and appraisal system, continuously transforming and upgrading the industrial structure and stopping the migration of heavy industry from east to west, south to north and city to countryside. (C) 2013 Published by Elsevier Ltd.
|
| [31] |
Eco-efficiency trends in China, 1978-2010: Decoupling environmental pressure from economic growth [J].https://doi.org/10.1016/j.ecolind.2012.06.007 URL Magsci [本文引用: 1] 摘要
This paper reports China's eco-efficiency trends and the cause of their dynamic behavior during the period 1978-2010. We show three main results. First, in general, eco-efficiency indicators increased for resource utilization, energy consumption and emissions for air and water, and relative decoupling occurred in China at a high level in the global context. Second, decoupling from economic growth has been absolute for the discharge of soot, chemical oxygen demand (COD) and ammonia nitrogen. Third, during the years 2001-2010, the decoupling level was very low, and resource utilization was almost coupled with GDP due to the high consumption and dramatic increase of mineral extraction.<br/>The causes of the observed dynamics of eco-efficiency and decoupling were also explored, with the conclusion drawn that the effect of technology was the predominant positive factor while structure effects were the negative factors for resource and energy efficiency; the technological effect of pipe-end treatment played a dominant role in the improving eco-efficiency of pollutant emissions and decoupling from economic growth. Furthermore, implications for further policymaking to setting proper targets for the relative decoupling of resource use, especially for mineral resource use and economic growth, are suggested. (C) 2012 Elsevier Ltd. All rights reserved.
|
| [32] |
Emergy analysis of the urban metabolism of Beijing [J].https://doi.org/10.1016/j.ecolmodel.2010.09.017 Magsci [本文引用: 1] 摘要
Cities can be modeled as if they were superorganisms with a range of metabolic processes. Research on this urban metabolism can contribute to solving urban environmental problems by revealing details of the metabolic throughput of the system. A key issue is how to find a common basis for measuring the environmental and economic values. By providing a single unified unit, emergy theory integrates the natural and socioeconomic systems and thoroughly evaluates a system's metabolism. We analyzed Beijing's urban metabolic system using emergy synthesis to evaluate its environmental resources, economy, and environmental and economic relations with the regions outside the city during 14 years of development. We compared Beijing's emergy indices with those of five other Chinese cities and of China as a whole to assess Beijing's relative development status. These indices are the emergy self-support ratio (metabolic dependence), the environmental load ratio (metabolic loading), empower density (metabolic pressure), emergy used per person (metabolic intensity per capita), and the monetary equivalent of emergy (emdollars: metabolic intensity). Based on our emergy analysis, Beijing's socioeconomic system is not self-sufficient, and depends greatly on external environmental resources. Its GDP is supported by a high percentage of emergy purchased from outside the city. During the study period, Beijing's urban system showed an increasing dependence on external resources for its economic development. Beijing's loading and pressure on the ecological environment is continuously increasing, accompanied by continuously increasing human emergy consumption. In the future, it will become increasingly necessary to improve Beijing's metabolic efficiency. (C) 2010 Elsevier B.V. All rights reserved.
|

/
| 〈 |
|
〉 |
