陈建国 , 周素红, 肖露子
CHEN Jianguo, ZHOU Suhong, XIAO Luzi
通讯作者:
版权声明: 2016 地理科学进展 《地理科学进展》杂志 版权所有
基金资助:
作者简介:
作者简介:陈建国(1980-),男,湖北松滋人,博士研究生,研究方向为时空可达性,E-mail: chenjianguosysu@163.com。
展开
摘要
时间是急救服务的敏感因素,急救服务设施可达性的时空差异对于评估急救设施的选址及急救服务调度的效率,解决公众急救医疗需求与供给之间的矛盾,辅助政府部门的决策都至关重要。交通拥堵是常见的城市问题,尤其是在城市中心区域更为明显,由于交通拥堵带来的时间滞后对急救服务产生的影响不容忽视。本文通过浮动车GPS大数据,分析交通拥堵对广州市中心城区急救医疗设施时空可达性的影响。结果表明:①在考虑道路实际通行状况的情况下,在交通高峰期,社区的急救医疗服务平均可达时间和最长可达时间分别比采用设计时速计算增加20%和25%。②可达性存在明显的时空差异。急救医疗服务可达性以急救医院为中心,沿着路网向四周呈现衰减趋势。急救医院布局较多、路网密集区域的可达性高,反之则低。交通拥堵对路网密集、行车规则设计复杂以及存在通过性交通流的地区影响显著。③对不同阻抗系数下可达性变化的敏感性分析,发现随着阻抗系数的增大,可达性变化的趋势有所放缓,紧急医疗服务可达性的分异变小;这一变化趋势在交通平峰期表现更为明显。因此,在研究城市中心区域急救医疗服务时,考虑交通拥堵对可达性的影响,需要构建基于实时交通状况的可达性评估模型,合理选择模型参数,优化实时急救医疗服务调度,提升急救服务的效率和质量。
关键词:
Abstract
Time is a sensitive factor in emergency medical service (EMS). The spatial and temporal differences of EMS accessibility are important for the assessment of siting of emergency facilities and the efficiency of emergency service dispatch. Traffic congestion is a common problem in the central areas of cities, and the impact of congestion on EMS accessibility cannot be ignored. In this study, the impact of traffic congestion on the temporal and spatial accessibility to EMS in the city of Guangzhou was analyzed by using the floating car data. The results show that: (1) During rush hours, the average and longest time between 120 hospitals and communities are 17% and 19% higher respectively than using standard road speed. (2) The accessibility of EMS to an emergency hospital as the center decays along the road network. The accessibility of EMS is high where the emergency hospital number is large and the road network is dense, and vice versa. The impact of traffic congestion on EMS accessibility is significant in areas where the road network and traffic rule are complex. (3) With the increase of time impedance, accessibility change slowed. This trend is more obvious in off-rush hours. Therefore, real-time traffic condition should be considered in research on EMS accessibility to optimize EMS scheduling and improve the efficiency.
Keywords:
可达性在地理学、经济学和城市规划学等领域得到广泛应用,虽然对该词的解释各不相同,但其本质都一样,即在考虑交通成本的情况下,从一个地方到达另一个地方的难易程度(McGrail et al, 2009)。在可达性的研究中,交通成本通常被认为是影响服务设施潜在利用率的重要因素。交通成本高的区域可达性低,而交通成本低的地区可达性高。可达性的度量有多种方法,简单的有通行时间、行程距离等;复杂的度量指标不仅考虑空间邻近性,还会考虑设施的可用性,如重力模型和两步移动搜索法等。无论是简单的还是复杂的度量指标,在大多数的可达性计算中都需计算设施与需求点之间的交通成本。
交通成本测算的方法很多,欧几里得距离由于简单易用且数据容易获取,因而是一种常用的交通成本度量指标(Burns et al, 1992; Phibbs et al, 1993; 尹海伟等, 2008)。以欧氏距离衡量交通成本是假设需求点和设施点都位于均质平原上,而实际上地理空间是非均质空间,空间上的人和物的流动大多是沿着道路网络而非直线距离。在城市复杂的道路交通系统中,从需求点到设施点之间的直线距离与路网距离往往有较大差距,尤其是当路网存在单行道或者有限行措施时。随着地理信息系统的发展和个人电脑计算能力的提高,计算需求点和设施点之间沿道路网络的距离成为可能,以路网距离作为度量交通成本的指标在一定程度上提高了可达性计算的精确度(李小马等, 2009)。
与空间距离相比,时间距离与心理距离更接近。因此当顾客选择光顾哪个设施的时候,在不考虑设施差别的基础上,往往会选择出行时间最短的,而不是距离最近的。为使可达性更接近实际情况,时间距离作为交通成本引入到可达性计算中。要获取道路的实际通行时间是一项费时费力的工作,为了简化问题,研究人员通常采用各道路的速限速度(潘竟虎等, 2012)或根据道路的等级按设计速度计算路段的通行时间(靳诚等, 2009; 王姣娥等, 2012)。
无论是采用速限速度还是设计速度作为交通成本都有一个假设前提,即人或车在道路上的行进速度是固定的,按照道路的设计速度或速限速度通行(蒋海兵等, 2010; 邓羽等, 2012; 潘竟虎等, 2012),而这显然不符合交通网络的实际情况。城市交通系统的运行存在“潮汐”现象,即交通高峰期和平峰期,在不同交通时期,道路的拥堵状况不同,车辆的通行速度也不一样。同时由于人的日常活动存在一定的节律性,同样的道路在不同时间的交通量有明显差异,导致了道路通行速度的不同。相同等级的道路,在同一时刻、不同地点的通行能力也会不同。交通成本是一个对时间敏感的指标,它会随时间和地点的不同而差异显著。交通系统、土地利用类型和社会经济环境之间复杂的相互作用,使道路交通状况的时空动态性和时空异质性特征明显。传统的空间可达性研究缺乏对交通成本动态变化的考虑,而这种变化对时间敏感的服务至关重要,因此有必要在可达性的研究中增加时间维度即时空可达性。
120急救服务是医疗体系的重要组成部分。各种危重急症、意外伤害事故以及突发的灾难等,都需要专业医护人员尽快到达现场进行紧急救助,以维持伤病员生命体征的稳定,然后再转送相应的医院进一步诊治。救护车上的医用警灯和警报就是为了让救护车以最短的时间到达救助现场而采取的措施(Shah, 2006)。研究表明,医护人员能在尽可能短的时间内赶到事发现场并采取相应的救助措施就可以显著提高患者的存活率(Blackwell et al, 2002; Pons et al, 2005)。因此,在研究医疗急救服务的可达性时,如果采用更精确的交通成本就可能对医疗服务效率和水平作出更准确的评价。
随着中国城市化进程的快速发展,大量的人口涌入城市,导致城市的规模不断扩大,城市交通需求量猛增。同时,由于社会经济水平的提高,中国机动车拥有量急剧增加,机动化出行的比例不断上升,导致城市交通问题日益突出,尤其是大城市交通拥堵非常严重。交通拥堵导致车辆在道路上并不能按设计速度行驶,其实际通行速度往往低于设计时速。因而采用设计时速会使可达性的估计产生偏差,但是偏差多大,在什么情况下偏差更严重,如何考虑偏差优化急救服务等问题,急需检验和回答。
随着无线定位和通讯技术的不断发展,基于GPS的浮动车能够实现全天候、大范围的动态交通信息采集,使得道路实际交通状况的可达性研究成为可能。目前浮动车GPS数据在交通和城市研究领域有着广泛应用,如交通事故自动监测(Thomas, 1998)、路网运行效率监控(Berkow et al, 2009)、人的出行行为分析(Liu et al, 2010; Liu et al, 2012)、城市医疗设施的服务范围研究(Ertugay et al, 2011)以及道路通行时间的估计(Van Lint, 2006; Liu et al, 2009; Jenelius et al, 2013)等。但已有研究主要集中在探讨交通状况或者公共服务供给问题(宋正娜等, 2009; 樊立惠等, 2015),缺乏考虑交通状况对公共服务供给,特别是公共服务可达性的影响,而这对于很多公共服务可达性尤其是对时间要求严格的急救医疗服务可达性很重要。本文以广州市中心城区120急救服务系统为例,利用GIS网络分析功能,基于浮动车行驶数据估算道路通行速度,分析交通拥堵对急救医疗设施时空可达性的影响。
中心城区往往是交通条件最复杂、道路最拥堵的区域,因此,本文选取广州市内环以内的中心城区为研究对象,以社区居委会为基本空间单元进行医疗急救服务时空可达性分析。首先,根据高德发布的《2014年第三季度中国主要城市交通分析报告》,广州市拥堵指数列全国第三,交通拥堵非常严重;其次,广州市120由急救指挥中心统一调度,以最短的时间到达病患者所在的位置是急救指挥的主要调度原则,在无特殊情况的条件下,一般不考虑其他因素;第三,近年来,广州市大力发展智能交通系统,全市16000多辆出租车全部安装GPS定位系统,可比较准确地估计各路段在不同时间的行车速度。研究区域内共有360个社区,分属越秀区、荔湾区和海珠区等3个区管辖。
2.2.1 120急救医院数据
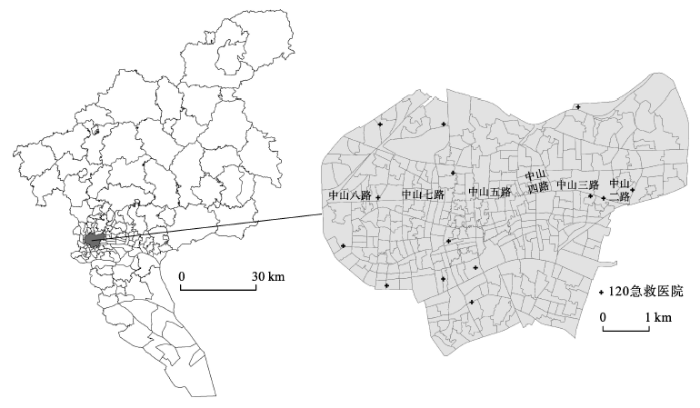
根据广州市急救中心网站公布的数据,广州市共有58家120急救医院(不包括从化市和增城市),其中14家位于研究区内(图1)。该区域覆盖人口142万,占120医院总覆盖人口的18%,120医院数量占总量的24%。从医院分布来看,急救医院的数量并不少,但空间分布不均衡(图2)。在东部急救医院过于集中,最近的两家医院(广东省人民医院和中山大学附属第一医院)距离仅300 m,而中部缺少急救医院。这种空间格局的形成与广州市急救医院的遴选机制有关。广州市120网络医院并非由政府指定,而是由相关医院提出申请,通过卫生主管部门评审,合格之后纳入120医院网络。各120急救医院所拥有的急救车数量由广州市急救医疗指挥中心提供。
图1 广州市内环以内120急救医院分布
Fig.1 Distribution of Emergency Medical Service (EMS) in Guangzhou
2.2.2 GPS数据
为避开节假日和天气状况对GPS数据产生的干扰,通过查阅历史天气数据发现,2013年5月6-10日,广州市均为晴天且不包含可能引发道路通行特征变化的特殊事件和公众节假日,能够表征广州市道路通行的常态特征。因此,本文以该时间段广州市出租车的运行数据为基础,经过数据清洗、地图匹配,最后采用速度—时间积分模型或距离—时间积分模型(根据GPS点的采样间隔决定),参考曾伟良等(2013)的方法对广州市路网各路段的速度进行估计。以5 min为时间间隔估计路段的行车速度,即每条路段每5 min有一个行车速度估计值,根据各路段的通行速度得出路段通行时间。由于城市交通车存在潮汐交通流,同一路段不同方向的速度也有差异,如在早高峰时段,往城市中心区的方向比出城的方向行车缓慢。因此,所用的路段通行时间也是按行车方向有所不同。为分析急救医疗服务的时空可达性,对交通时段进行了划分,包括高峰时段(7:00-9:00)和平峰时段(13:00-15:00)。
2.2.3 其他数据
对急救医疗时空可达性的分析还需研究区域内各社区居委会的行政区划边界图和路网数据等。由于模型考虑了供需关系,因此人口的分布状况对可达性计算的结果有重要影响,本文的人口数据为广州市第六次人口普查数据。将以上空间数据都采用统一的空间坐标系统,用ArcGIS软件进行管理。
Hansen 在1959 年首次提出采用基于重力模型的方法度量空间可达性,并定义了设施的吸引力和交通成本的度量方式。Joseph等(1982)在考虑供需的基础上改进了重力模型,并将其运用于基础医疗服务领域。此后,该模型在可达性的各个方向,包括就业(Shen, 1998)和医疗(Yiannakoulias et al,2013)等都得到了广泛应用。根据广州市急救医疗中心提供的资料,各急救医院可供急救指挥中心调度的急救车为一台。当急救医疗指挥中心接到急救电话之后,就指派距离患者最近的急救医院出车救助,如果最近医院的急救车由于外出执行任务或维修不能出车,则安排距离患者第二近的急救医院出车,以此类推直到可以派出急救车。在理论上,当有医疗急救求助时,任何一家医院都有出车救助的可能。广州市急救医疗指挥中心的历史数据显示,实际运作过程中,在距离事发地点最近的前三个急救医院中通常都能派出急救车辆。因此,本文采用重力模型分析城市中心城区急救医疗时空可达性,其具体形式如下:
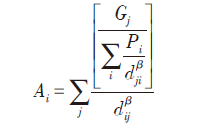
式中:
本文主要从以下两方面进行分析:交通拥堵对道路绝对通行时间的影响及对基于重力模型的时空可达性的影响分析。
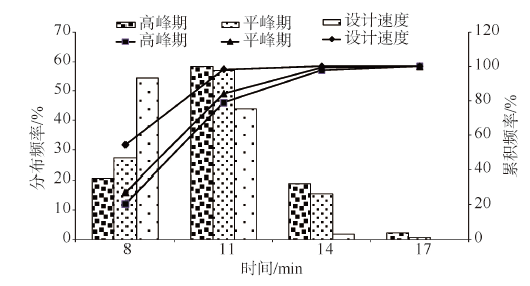
根据《广州市社会急救医疗管理条例》的规定,广州市急救车出发时间为6 min,即从接到急救电话到急救车出发只有6 min。本文以2 min 的道路通行时间为起点,将可达性分为4个级别,分别为2、5、8和11 min,加上出车的准备时间6 min之后,分别为8、11、14和17 min。分别统计不同交通成本下各社区到最近急救医院的时间。在设计速度的条件下,社区距离最近120医院的平均时间为7.9 min,最长11.9 min。内环区域内95%的居民距离最近的120医院为10.8 min。在交通高峰期,广州市内环区域内120的平均可达时间为9.5 min,最长时间为14.9 min,与设计速度相比分别增加1.6 min和3 min。内环区域内95%的居民距离最近的120医院为14.4 min。在平峰时段,内环区域内的120平均可达时间为9.2 min,最长时间为14.2 min,与设计速度情况相比,分别增加1.3 min和2.3 min。内环区域内95%的居民距离最近的120医院为13.2 min。
从分布频率来看(图2),不管在采用哪种速度计算,通行时间均在8~11 min分布最广;交通高峰期、交通平峰期和设计速度占全区总数的累积频率分别为80%、84%和98%。从频率分布的整体走势来看,分布频率随时间的增长在数量上呈现“偏正态”的先上升后下降分布结构,在14 min以后下降趋势强烈。
从通行时间来看,采用道路设计速度计算的通行时间会比实际通行时间少,但对于不同的交通时段来说,偏离的程度不同。从社区到最近120医院的平均时间来看,在平峰时段,采用设计时速计算所得的通行时间仅为实际道路通行时间的85%;在交通高峰期,以设计速度计算从社区到达急救医院的最长时间为实际道路通行速度所计算通行时间的80%。由于交通拥堵的存在,车辆不可能在道路上以设计速度行驶。以上分析表明,在计算道路的通行时间时不考虑交通状况会导致理论的道路通行时间少于实际通行时间,并且这种偏差在交通高峰期更为显著。
考虑道路的实际通行情况之后,在交通高峰期,急救医院到需求点的平均时间是不考虑交通状况时间的1.85倍。这与直觉相符,在城市中心区域,车辆的行车速度几乎不可能达到道路的设计速度。即如不考虑道路的通行条件,路网的通行时间会被低估。在院前急救时,越早将医生和医疗设备送到需求点越能更大限度地挽救病人的生命。是否考虑交通状况导致需求点和急救医院之间的通行时间有显著差异,因此在实际急救服务调度的过程中需要充分考虑道路的拥堵,合理调度急救车和规划行车路线。本文尚未考虑在不同交通状况下道路转弯和红绿灯处所需要的等待时间的区别,这种差异在交通拥堵的高峰期会更明显,亦即,在交通高峰期需要更长的转弯和交通信号灯等待时间,从而会导致在不同道路拥堵状况下交通时间的差异更大。
采用不同的道路通行速度计算所得的可达性之间不具可比性,本文根据需求点可达性的高低将需求点平均分成4个等级:第一等级(Q1)、第二等级(Q2)、第三等级(Q3)、第四等级(Q4),即可达性由高到低为:Q1>Q2>Q3>Q4。如表1所示,与设计速度相比,在高峰时段,有206个需求点的可达性等级未发生变化(57.22%),在平峰时段有154个需求点(42.78%)的可达性发生了变化。
表1 基于重力模型的时空可达性变化
Tab.1 Changes in gravity-based spatial accessibility quartiles
| 高峰时段可达性 | 平峰时段可达性 | |||||||||
|---|---|---|---|---|---|---|---|---|---|---|
| Q1 | Q2 | Q3 | Q4 | Q1 | Q2 | Q3 | Q4 | |||
| 设计速度可达性 | Q1 | 58 | 26 | 6 | 0 | 62 | 20 | 7 | 1 | |
| Q2 | 22 | 39 | 24 | 5 | 17 | 40 | 26 | 7 | ||
| Q3 | 8 | 20 | 43 | 19 | 9 | 23 | 40 | 18 | ||
| Q4 | 2 | 5 | 17 | 66 | 2 | 7 | 17 | 64 | ||
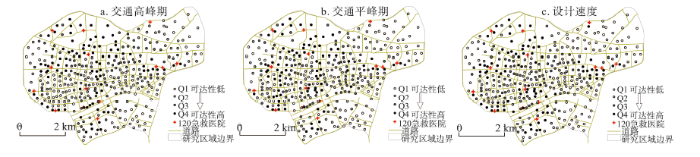
图3显示了采用不同道路通行速度计算的各社区紧急医疗服务的可达性。由图3可知,可达性差的需求点在研究区的东北角分布较多,这可能与该区域120急救医院分布较少有关。由于路网形态和局部建成环境的影响,社区的急救医疗服务可达性以急救医院为中心,沿着路网向四周衰减。在120医院较为集中且路网密度高的区域,社区的可达性好;在120医院较少,同时路网较为稀疏的东北角和东南角,社区的可达性差。
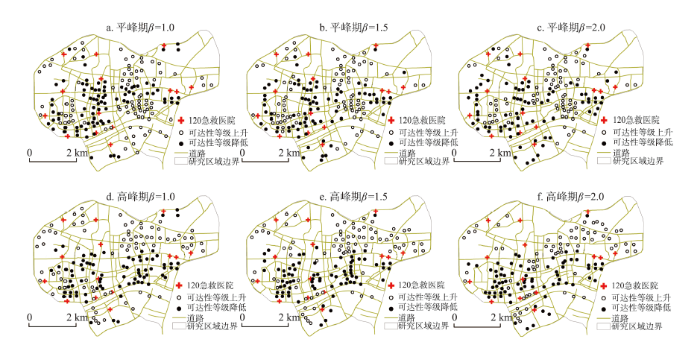
图4为在不同速度计算方式下各社区相对可达性的变化情况。其中,黑色社区表示在考虑了道路的交通状况之后可达性等级降低的社区,白色社区表示可达性等级上升的社区,可达性没有发生变化的社区在图中未显示。此处的可达性变化是指社区在不同的道路行车时间的基础上,各社区急救医疗可达性位序的变化。因此,在考虑道路通行状况后,一些社区的可达性等级会由于其他社区可达性等级的降低而上升。
图4 不同阻抗下急救医疗服务时空可达性等级变化
Fig.4 Changes in Emergency Medical Service (EMS) spatial accessibility under different time impedances
本文的研究重点不在于单个社区可达性的变化,而是交通拥堵对时空可达性空间格局的影响。采用不同的交通成本度量方式,急救设施在交通平峰期的可达性空间格局没有明显变化,但交通高峰期的可达性空间格局变化显著。图4中,研究区的西北部区域的急救医疗可达性对是否考虑交通拥堵不敏感,其他区域的可达性都在一定程度上受交通拥堵的影响。这种现象与城市的空间结构特征相吻合,可达性在城市支路较少、路网稀疏以及路网结构简单的区域受交通拥堵的影响小。造成这种空间格局的另一种可能的原因是可达性受交通状况影响严重的区域与海珠区交界,在交通高峰期会有大量的过境车流通过,导致行车缓慢,通行时间增加,区域的可达性降低。北部的中山路以北地区的部分社区急救医疗可达性在交通高峰期相对提升,主要是由于南部的社区可达性等级降低所致。
在重力模型中β是距离衰减系数或阻尼系数,用于表示距离对供给点和需求点之间相互作用力的大小。β越大,表明距离的阻碍作用越大;反之亦然。在本文中的距离以时间距离度量。根据有关研究(Liu et al, 2012; Gao et al, 2013),在不同空间尺度下,β的取值范围不同。在城市内部,距离衰减系数通常为1~2。对不同的β取值作敏感性分析的结果如图4和表2所示。
表2 不同阻抗下可达性等级变化的社区数量
Tab.2 Number of census tracts of spatial accessibility change under different time impedances
| 交通平峰期可达性 | 交通高峰期可达性 | ||||||
|---|---|---|---|---|---|---|---|
| 等级 升高 | 等级 不变 | 等级 降低 | 等级 升高 | 等级 不变 | 等级 降低 | ||
| β=1.0 | 85 | 189 | 86 | 77 | 205 | 78 | |
| β=1.5 | 80 | 201 | 79 | 80 | 204 | 76 | |
| β=2.0 | 79 | 206 | 75 | 80 | 206 | 74 | |
从可达性变化的社区数量上看,随着β的增大,在交通平峰期,可达性等级发生变化的社区逐渐减少;在交通高峰期,可达性等级发生变化的社区变化不大。在考虑实际道路交通状况的基础上,β的取值对可达性的影响不大,但在不考虑拥堵的情况下,急救医疗可达性变化的社区会随着β取值的增大而减少。在交通拥堵严重的交通高峰期,拥堵造成的时间滞后对β的变化起到了平滑效果。
从可达性变化整体的空间格局来看,β的取值对急救医疗设施可达性的影响不明显(图4)。无论是在交通高峰期还是在平峰期,都是中山路以南地区的社区可达性等级降低而以北地区的可达性等级得以提升。随着β值的增大,在中山路沿线可达性等级降低的社区数量逐渐减少,且在平峰期更为明显。中山路沿线的社区距离急救医院普遍较远,急救车到达这些社区的阻力较大,而这种情况又会被交通拥堵带来的影响所缓和。
可达性是经典的地理学研究问题,在可达性的研究中需要度量设施点与需求点之间的交通成本。欧氏距离、曼哈顿距离和网络距离是常用的交通成本测度指标,但人们选择光顾哪个设施往往是以交通时间作为重要的依据而不是路程,以时间测算交通成本更能符合设施选择的实际情况。在可达性研究中增加时间维度,发展时空可达性模型是可达性研究的趋势。本文由浮动车GPS数据估计道路的实时行车速度,并以此为基础分析了广州市中心城区的急救医疗时空可达性。对比分析了3种不同交通状况下各社区急救医疗服务时空可达性的变化。3种交通状况分别为:以设计时速行驶、交通高峰期和平峰期。主要结论如下:
(1) 从道路通行时间来看,在考虑了道路拥堵状况后,道路的通行时间有所增加,不同的交通时段,增加的程度不同。与采用设计速度相比,平峰期急救医疗服务的平均可达时间和最长可达时间分别增加了17%和19% (1.3 min和2.3 min),高峰期的平均可达时间和最长可达时间分别增加了20%和25% (1.6 min和3 min)。
(2) 急救医疗服务可达性以急救医院为中心,沿着路网向四周呈现衰减趋势。急救医院布局较多、路网密集区域的可达性高,反之则低。交通拥堵对路网密集、行车规则设计复杂以及存在通过性交通流的地区影响显著。
(3) 对不同阻抗系数下可达性变化的敏感性分析结果表明:随着阻抗系数的增大,可达性变化的趋势有所放缓,紧急医疗服务可达性的分异变小。这一变化趋势在交通平峰期表现更为明显。交通高峰期可达性变化的情况对阻抗系数不敏感。
对于时间就是生命的急救服务而言,考虑交通拥堵对其设施时空可达性的影响尤为重要。需构建基于实时交通状况的可达性评估模型,优化实时急救服务调度,提升服务效率和质量。本文未考虑各区域人口结构特征差异对急救医疗服务需求的影响,如在老年人口分布较多的区域和事故高发地区有更多的急救服务需求等。另外由于数据的限制,红绿灯对道路通行时间的影响也没有考虑。这些社会经济因素与交通拥堵的耦合作用对时空可达性的影响还有待今后进一步的深入研究。
The authors have declared that no competing interests exist.
| [1] |
北京城区交通时间可达性测度及其空间特征分析 [J].
道路基础设施建设是城市运营与发展的基本环节,也是实现城乡基础设施一体化的重要途径与内容。北京市长期实行“环状+发射状”的城市路网格局,对城市基础设施建设和时间可达性产生了重要影响。尤其是近些年来,随着城市机动车保有量的快速增加,城市核心区与主要干道的交通设施负载量巨增,严重制约了城市的通勤效率,加重了人民的生活负担。为应对挑战,实现交通设施跨越式发展,北京市自2008 年以来加快了轨道交通建设步伐,以改善城市的通勤能力。本文采用一般道路设施与轨道交通(矢删数据) 结合的方法对北京城区进行了时间可达性的综合度量和其空间特征的分析。通过可达性与道路密度双重指标的运用进行区域综合分区,本文进一步揭示了北京市城区内的空间可达性特征和道路基础设施建设情况以及两者在南北城区内的空间表征差异。在综合分区的基础上,分析2008 年以来各个区域土地利用效益与区位因素的相互关系,甄别土地利用效益区位因素的区域差异性,从而对不同分区的城市建设、城市发展规划与土地资源优化配置提供科学支撑。
Measuring time accessibility with its spatial characteristics in urban areas of Beijing [J].
道路基础设施建设是城市运营与发展的基本环节,也是实现城乡基础设施一体化的重要途径与内容。北京市长期实行“环状+发射状”的城市路网格局,对城市基础设施建设和时间可达性产生了重要影响。尤其是近些年来,随着城市机动车保有量的快速增加,城市核心区与主要干道的交通设施负载量巨增,严重制约了城市的通勤效率,加重了人民的生活负担。为应对挑战,实现交通设施跨越式发展,北京市自2008 年以来加快了轨道交通建设步伐,以改善城市的通勤能力。本文采用一般道路设施与轨道交通(矢删数据) 结合的方法对北京城区进行了时间可达性的综合度量和其空间特征的分析。通过可达性与道路密度双重指标的运用进行区域综合分区,本文进一步揭示了北京市城区内的空间可达性特征和道路基础设施建设情况以及两者在南北城区内的空间表征差异。在综合分区的基础上,分析2008 年以来各个区域土地利用效益与区位因素的相互关系,甄别土地利用效益区位因素的区域差异性,从而对不同分区的城市建设、城市发展规划与土地资源优化配置提供科学支撑。
|
| [2] |
北京市公共服务设施供需协调发展的时空演化特征: 以教育医疗设施为例 [J].Spatial-temporal succession characteristics of public service facilities supplyand demand coordinated development in beijing: A case study of educational and medical facilities [J]. |
| [3] |
基于时间可达性与伽萨法则的大卖场区位探讨: 以上海市中心城区为例 [J].
<p>目前多数基于GIS的商业区位模型与技术研究,未全面考虑交通网络、道路等级、网点吸引力与竞争因素。针对此局限,借助GIS软件,依托可达性方法与伽萨法则,尝试综合考虑上述因素探讨大卖场可达性与商圈特征。以上海中心城区大卖场为例,采用同心圆法、扇形法与最近邻域法探讨卖场空间特征;利用行进成本分析法计算卖场可达性,并根据伽萨法则叠加了卖场引力因素,得到伽萨法则商圈。结果表明:大卖场集中分布于距市中心4.5~10km范围,各方向扩张不均衡。城区整体可达性较好,浦西优于浦东。外环附近商圈面积大,外环附近与市中心区商圈市场规模大,内环附近商圈面积与市场规模小。伽萨法则商圈市场规模"两极分化"既表明卖场市场竞争激烈地区与网点短缺区并存,也说明网点市场规模与职能存在等级差异。</p>
The quantitative analysis of large scale supermarkets location based on time accessibility and Gasa rules [J].
<p>目前多数基于GIS的商业区位模型与技术研究,未全面考虑交通网络、道路等级、网点吸引力与竞争因素。针对此局限,借助GIS软件,依托可达性方法与伽萨法则,尝试综合考虑上述因素探讨大卖场可达性与商圈特征。以上海中心城区大卖场为例,采用同心圆法、扇形法与最近邻域法探讨卖场空间特征;利用行进成本分析法计算卖场可达性,并根据伽萨法则叠加了卖场引力因素,得到伽萨法则商圈。结果表明:大卖场集中分布于距市中心4.5~10km范围,各方向扩张不均衡。城区整体可达性较好,浦西优于浦东。外环附近商圈面积大,外环附近与市中心区商圈市场规模大,内环附近商圈面积与市场规模小。伽萨法则商圈市场规模"两极分化"既表明卖场市场竞争激烈地区与网点短缺区并存,也说明网点市场规模与职能存在等级差异。</p>
|
| [4] |
基于路网结构的旅游景点可达性分析: 以南京市区为例 [J].
<p>运用旅游景点可达性方法来定量地研究城市旅游空间结构,开发基于最短时间路径选择算法的旅游景点可达性计算与分析信息系统,基于南京市区的公路路网结构,对南京市区旅游景点可达性做了实证研究,生成了景点可达性的分值扩散图、时间等值线图、旅游景点服务范围图和以乡镇为基本计算单元的景点可达性图。通过对生成图表的分析,笔者发现:南京市区旅游景点整体可达性较好,80.59%的区域景点可达性在40min之内,但其内部差异也比较明显,中心主城区景点可达性较好,外围地区特别是边界地区景点可达性较差,最差地区为103min39s,通过对乡镇为基本计算单元的整体景点可达性的等级分析,发现南京市区景点可达性在地域分布上呈现以主城区为中心的圈层空间结构。在上述分析的基础上,将南京市区分为主城区、近郊区、远郊区三个区域,根据三个地区各自特点制定了相应的景点可达性优化目标,并给出了优化措施。</p>
An analysis of accessibility of scenic spots based on land traffic network: A case study of Nanjing [J].
<p>运用旅游景点可达性方法来定量地研究城市旅游空间结构,开发基于最短时间路径选择算法的旅游景点可达性计算与分析信息系统,基于南京市区的公路路网结构,对南京市区旅游景点可达性做了实证研究,生成了景点可达性的分值扩散图、时间等值线图、旅游景点服务范围图和以乡镇为基本计算单元的景点可达性图。通过对生成图表的分析,笔者发现:南京市区旅游景点整体可达性较好,80.59%的区域景点可达性在40min之内,但其内部差异也比较明显,中心主城区景点可达性较好,外围地区特别是边界地区景点可达性较差,最差地区为103min39s,通过对乡镇为基本计算单元的整体景点可达性的等级分析,发现南京市区景点可达性在地域分布上呈现以主城区为中心的圈层空间结构。在上述分析的基础上,将南京市区分为主城区、近郊区、远郊区三个区域,根据三个地区各自特点制定了相应的景点可达性优化目标,并给出了优化措施。</p>
|
| [5] |
基于网络分析的沈阳城市公园可达性和服务 [J].
城市公园是城市生态系统中主要的自然景观元素,发挥着重要的生态、经济、和社会效益。随着人们生活水平的提高,城市公园的休闲游憩功能倍受关注。以沈阳为例,基于GIS的网络分析法,结合道路和人口分布分析了沈阳及其各行政区城市公园的可达性和服务状况。结果显示:(1)网络分析法较缓冲区法更能准确地评价城市公园的可达性,两个服务评价指标(服务面积比和服务人口比)较传统的统计指标更能准确地反映城市公园的服务情况;(2)通过网络分析,研究区仅有19.47%的面积和43.41%的市民能够在15min内步行到达公园,沈阳城市公园数量不足且空间分布不均匀;(3)市区城市公园分布和服务情况好于郊区。沈河区、和平区和皇姑区城市公园可达性最好,东陵区、铁西区和大东区次之,于洪区和浑南新区可达性最差。基于GIS的网络分析法能够准确评价城市公园可达性,并可用于城市其它服务设施(学校、超市、医疗机构等)的可达性研究。研究获得了沈阳城市公园空间分布和服务状况的准确资料,为沈阳城市公园的空间布局优化提供参考。
Accessibility and service of Shenyang’s urban parks by network analysis [J].
城市公园是城市生态系统中主要的自然景观元素,发挥着重要的生态、经济、和社会效益。随着人们生活水平的提高,城市公园的休闲游憩功能倍受关注。以沈阳为例,基于GIS的网络分析法,结合道路和人口分布分析了沈阳及其各行政区城市公园的可达性和服务状况。结果显示:(1)网络分析法较缓冲区法更能准确地评价城市公园的可达性,两个服务评价指标(服务面积比和服务人口比)较传统的统计指标更能准确地反映城市公园的服务情况;(2)通过网络分析,研究区仅有19.47%的面积和43.41%的市民能够在15min内步行到达公园,沈阳城市公园数量不足且空间分布不均匀;(3)市区城市公园分布和服务情况好于郊区。沈河区、和平区和皇姑区城市公园可达性最好,东陵区、铁西区和大东区次之,于洪区和浑南新区可达性最差。基于GIS的网络分析法能够准确评价城市公园可达性,并可用于城市其它服务设施(学校、超市、医疗机构等)的可达性研究。研究获得了沈阳城市公园空间分布和服务状况的准确资料,为沈阳城市公园的空间布局优化提供参考。
|
| [6] |
中国4A级及以上旅游景点(区)空间可达性测度 [J].
<p>基于GIS 技术, 运用栅格成本加权距离算法, 计算中国1 063 个4A级及以上旅游景点的空间可达性, 并测算县域单元的整体可达性, 利用空间关联方法分析了县域可达性的空间差异。结果表明:中国4A级及以上景点的空间分布总体上呈现出集聚分布的特点, 人文景点的聚集程度明显高于自然景点。全国4A级及以上景点的平均可达性时间为60.5 min, 63.29 %的景点可达性在120 min 以内;所有4A级及以上景点的可达性在全国的分布差异显著, 且其空间分布具有明显的交通指向性;人文景点可达性好的区域相对于自然景点更加集中。所有景点、人文景点、自然景点均呈强集聚格局, 3 种类型可达性热点区域的分布呈现明显的热点-次热点-次冷点-冷点自东向西带状分布的格局。</p>
Spatial accessibility of scenic spot at 4A level and above in China [J].
<p>基于GIS 技术, 运用栅格成本加权距离算法, 计算中国1 063 个4A级及以上旅游景点的空间可达性, 并测算县域单元的整体可达性, 利用空间关联方法分析了县域可达性的空间差异。结果表明:中国4A级及以上景点的空间分布总体上呈现出集聚分布的特点, 人文景点的聚集程度明显高于自然景点。全国4A级及以上景点的平均可达性时间为60.5 min, 63.29 %的景点可达性在120 min 以内;所有4A级及以上景点的可达性在全国的分布差异显著, 且其空间分布具有明显的交通指向性;人文景点可达性好的区域相对于自然景点更加集中。所有景点、人文景点、自然景点均呈强集聚格局, 3 种类型可达性热点区域的分布呈现明显的热点-次热点-次冷点-冷点自东向西带状分布的格局。</p>
|
| [7] |
基于潜能模型的医疗设施空间可达性评价方法 [J].https://doi.org/10.11820/dlkxjz.2009.06.003 Magsci [本文引用: 1] 摘要
<p>空间可达性是评价医疗设施布局合理与否的重要指标,传统的医疗设施空间可达性评价,或者从医疗服务供需状况着手,或者从供需双方之间距离因素着手,均无法全面评价居民实际所能获取的医疗资源。本文采用基于潜能模型的评价方法对江苏省如东县医疗设施空间可达性进行分析研究,该方法综合考虑了医疗设施服务能力、居民点人口数量、医疗设施与居民点之间的出行阻抗。研究表明,通过选取合适的出行摩擦系数,该方法能够较为全面准确地测度较小研究单元的医疗设施空间可达性,辅以GIS技术,可以很直观地揭示研究区域内医疗设施空间可达性差异,结合公共卫生管理部门制定的医疗资源配置标准,还可较为准确判定缺医地区,为政府相关部门规划决策提供依据。</p>
https://doi.org/10.11820/dlkxjz.2009.06.003 Magsci [本文引用: 1] 摘要
<p>空间可达性是评价医疗设施布局合理与否的重要指标,传统的医疗设施空间可达性评价,或者从医疗服务供需状况着手,或者从供需双方之间距离因素着手,均无法全面评价居民实际所能获取的医疗资源。本文采用基于潜能模型的评价方法对江苏省如东县医疗设施空间可达性进行分析研究,该方法综合考虑了医疗设施服务能力、居民点人口数量、医疗设施与居民点之间的出行阻抗。研究表明,通过选取合适的出行摩擦系数,该方法能够较为全面准确地测度较小研究单元的医疗设施空间可达性,辅以GIS技术,可以很直观地揭示研究区域内医疗设施空间可达性差异,结合公共卫生管理部门制定的医疗资源配置标准,还可较为准确判定缺医地区,为政府相关部门规划决策提供依据。</p>
|
| [8] |
基于空间距离和时间成本的中小文化旅游城市可达性研究 [J].https://doi.org/10.11849/zrzyxb.2012.11.014 Magsci [本文引用: 1] 摘要
<p>在区域旅游发展中,中小文化旅游城市是其重要内容之一。除旅游景点本身的吸引力之外,旅游目的地的可达性及旅游景点基础设施的完善是其旅游发展的重要内容,因此中小文化旅游城市的可达性研究具有重要意义。基于GIS软件,论文从空间距离和时间成本角度对全国34个中小文化旅游城市的可达性进行研究。结果表明:我国中小文化旅游城市的可达性表现出非均衡的空间分布特征,其3 h可达服务范围(即游客市场)并未覆盖全国。其中,东北地区、华南地区、内蒙古高原、青藏高原等地区因中小文化旅游城市分布较少而出现可达服务范围的空白区域,而长江三角洲、成渝、鲁西南和海峡西岸等地区中小文化旅游城市的可达服务范围已绵延成片,具有较大的区域旅游合作潜力。此外,通过对中小文化旅游城市的旅游收入、旅游人数与可达范围内社会经济属性进行相关性分析,发现旅游收入与1 h可达范围内的GDP相关性最高,而旅游人数与50 km范围内的GDP相关性最高。</p>
Accessibility of medium-and small-sized cultural tourist cities based on spatial distance and time cost [J].https://doi.org/10.11849/zrzyxb.2012.11.014 Magsci [本文引用: 1] 摘要
<p>在区域旅游发展中,中小文化旅游城市是其重要内容之一。除旅游景点本身的吸引力之外,旅游目的地的可达性及旅游景点基础设施的完善是其旅游发展的重要内容,因此中小文化旅游城市的可达性研究具有重要意义。基于GIS软件,论文从空间距离和时间成本角度对全国34个中小文化旅游城市的可达性进行研究。结果表明:我国中小文化旅游城市的可达性表现出非均衡的空间分布特征,其3 h可达服务范围(即游客市场)并未覆盖全国。其中,东北地区、华南地区、内蒙古高原、青藏高原等地区因中小文化旅游城市分布较少而出现可达服务范围的空白区域,而长江三角洲、成渝、鲁西南和海峡西岸等地区中小文化旅游城市的可达服务范围已绵延成片,具有较大的区域旅游合作潜力。此外,通过对中小文化旅游城市的旅游收入、旅游人数与可达范围内社会经济属性进行相关性分析,发现旅游收入与1 h可达范围内的GDP相关性最高,而旅游人数与50 km范围内的GDP相关性最高。</p>
|
| [9] |
城市绿地可达性与公平性评价 [J].
城市绿地是城市重要的绿色基础设施,是实现城市可持续发展的重要空间保障,具有重要的生态、社会文化功能。20世纪80年代以来,我国一直以城市人均(公共、公园)绿地面积、绿地率、绿化覆盖率等面积比率指标作为核心指标来指导城市绿地建设,缺乏具体引导城市绿地空间分布的指标,较少关注城市绿地服务功能的公平性问题。借助于GIS技术,构建了城市绿地社会功能评价的简明框架,尝试将表征城市绿地空间分布的可达性和公平性指标引入城市绿地的功能评价中,以体现城市建设“以人为本”、“社会公平”的理念,并以上海和青岛为实证,对新构建的系列指标进行了分析与检验。研究结果表明:(1)可达性和公平性系列指标导入城市绿地的功能评价中是可行的,能够有效的表征和测度城市绿地空间布局的合理性程度;(2)可达性和公平性指标使用时需要界定研究区范围、研究尺度,特别是数据精度,以利于研究区的纵向比较和城市间的横向比较。研究结果将丰富我国城市绿地评价的核心指标体系,亦可为城市规划者和建设者合理规划与布局城市绿地提供重要的依据和参考。
Accessibility and equity assessment on urban green space [J].
城市绿地是城市重要的绿色基础设施,是实现城市可持续发展的重要空间保障,具有重要的生态、社会文化功能。20世纪80年代以来,我国一直以城市人均(公共、公园)绿地面积、绿地率、绿化覆盖率等面积比率指标作为核心指标来指导城市绿地建设,缺乏具体引导城市绿地空间分布的指标,较少关注城市绿地服务功能的公平性问题。借助于GIS技术,构建了城市绿地社会功能评价的简明框架,尝试将表征城市绿地空间分布的可达性和公平性指标引入城市绿地的功能评价中,以体现城市建设“以人为本”、“社会公平”的理念,并以上海和青岛为实证,对新构建的系列指标进行了分析与检验。研究结果表明:(1)可达性和公平性系列指标导入城市绿地的功能评价中是可行的,能够有效的表征和测度城市绿地空间布局的合理性程度;(2)可达性和公平性指标使用时需要界定研究区范围、研究尺度,特别是数据精度,以利于研究区的纵向比较和城市间的横向比较。研究结果将丰富我国城市绿地评价的核心指标体系,亦可为城市规划者和建设者合理规划与布局城市绿地提供重要的依据和参考。
|
| [10] |
结合卡尔曼滤波的城市路段速度估计 [J].
本文以城市出租车为浮动车数据采集源,介绍了基于GPS数据的实 时路段速度估计的基本方法.针对目标路段GPS数据样本量不足的情况,考虑邻近区域的路段速度、上周同日速度、前一时刻速度等与目标路段当前时刻速度等密 切相关的变量,建立多元线性回归方程,利用卡尔曼滤波融合预测值和测量值,从而提高路段行驶速度的估计精度.选择广州市东风路作为测试实例,融合值比测量 值误差降低9%,绝对相对误差变动系数减少4%,表明结合卡尔曼滤波技术的城市路段速度估计精度和稳定性均得到提高.
Urban link speed estimation with Kalman filter [J].
本文以城市出租车为浮动车数据采集源,介绍了基于GPS数据的实 时路段速度估计的基本方法.针对目标路段GPS数据样本量不足的情况,考虑邻近区域的路段速度、上周同日速度、前一时刻速度等与目标路段当前时刻速度等密 切相关的变量,建立多元线性回归方程,利用卡尔曼滤波融合预测值和测量值,从而提高路段行驶速度的估计精度.选择广州市东风路作为测试实例,融合值比测量 值误差降低9%,绝对相对误差变动系数减少4%,表明结合卡尔曼滤波技术的城市路段速度估计精度和稳定性均得到提高.
|
| [11] |
Prototype for data fusion using stationary and mobile data: Sources for improved arterial performance measurement [J].
|
| [12] |
Response time effectiveness: Comparison of response time and survival in an urban emergency medical services system [J]. |
| [13] |
The impact of physician characteristics in conditional choice models for hospital care [J].https://doi.org/10.1002/mus.23889 URL PMID: 10119756 [本文引用: 1] 摘要
Abstract Introduction: Surgery and childbirth can trigger attacks of hereditary brachial plexus neuropathy (HBPN), and inflammation was suggested as a component of the pathogenesis. Methods: HBPN patients who underwent surgery or parturition from January 1, 1996 to December 31, 2009 were studied. Results: Twenty-five HBPN patients underwent 48 surgeries or parturitions. Seventeen patients (68%) had attacks, including 13 periprocedural and 7 postpartum by varied anesthesia types. Three patients who had 8 earlier combined attacks (after thyroidectomy, laminectomy, and Caesarean section) were given prophylactic immunosuppressive therapy (corticosteroids 卤 immunoglobulin). None suffered postoperative attacks, which is uncharacteristic of their prior experience. Five had perioperative attacks as their first HBPN manifestation. Median follow-up was 11 months (3鈥48 months). Attacks occurred in the operated limb ( n = 6) or distant ( n = 7) to surgical sites. All attacks interfered with daily living, with frequent incomplete recovery. Five patients had a SEPT9 mutation. Conclusions: Corticosteroids may prevent parturition and surgical HBPN attacks in some patients. Diverse surgeries, anesthesia, and childbirth frequently trigger HBPN attacks. Muscle Nerve, 2013
|
| [14] |
GIS-based stochastic modeling of physical accessibility using GPS-based floating car data and Monte Carlo simulation [J].https://doi.org/10.1080/13658816.2010.528419 URL [本文引用: 1] 摘要
The term physical accessibility has long been used by geographers, economists, and urban planners and reflects the relative ease of access to/from several urban/rural services by considering the traveling costs. Numerous accessibility measures, ranging from simple to sophisticated, can be observed in the geographical information systems (GIS)-based accessibility modeling literature. However, these measures are generally calculated from a constant catchment boundary (a most likely or average catchment boundary) based on constant deterministic transportation costs. This is one of the fundamental shortcomings of the current GIS-based accessibility modeling and creates uncertainty about the accuracy and reliability of the accessibility measures, especially when highly variable speeds in road segments are considered. The development of a new stochastic approach by using global positioning system (GPS)-based floating car data and Monte Carlo simulation (MCS) technique could enable handling the variations in transportation costs in a probabilistic manner and help to consider all possible catchment boundaries, instead of one average catchment boundary, in accessibility modeling process. Therefore, this article proposes a stochastic methodology for GIS-based accessibility modeling by using GPS-based floating car data and MCS technique. The proposed methodology is illustrated with a case study on medical emergency service accessibility in Eskisehir, Turkey. Moreover, deterministic and stochastic accessibility models are compared to demonstrate the differences between the models. The proposed model could provide better decision support for the decision-makers who are supposed to deal with accessibility, location/allocation, and service/catchment area related issues.
|
| [15] |
Understanding urban traffic-flow characteristics: A rethinking of betweenness centrality [J].https://doi.org/10.1068/b38141 URL [本文引用: 1] 摘要
In this study we estimate urban traffic flow using GPS-enabled taxi trajectory data in Qingdao, China, and examine the capability of the betweenness centrality of the street network to predict traffic flow. The results show that betweenness centrality is not a good predictor variable for urban traffic flow, which has, theoretically, been pointed out in existing literature. With a critique of the betweenness centrality as a predictor, we further analyze the characteristics of betweenness centrality and point out the 鈥榞ap鈥 between this centrality measure and actual flow. Rather than considering only the topological properties of a street network, we take into account two aspects, the spatial heterogeneity of human activities and the distance-decay law, to explain the observed traffic-flow distribution. The spatial distribution of human activities is estimated using mobile phone Erlang values, and the power law distance decay is adopted. We run Monte Carlo simulations to generate trips and predict traffic-flow distributions, and use a weighted correlation coefficient to measure the goodness of fit between the observed and the simulated data. The correlation coefficient achieves the maximum (0.623) when the exponent equals 2.0, indicating that the proposed model, which incorporates geographical constraints and human mobility patterns, can interpret urban traffic flow well. Keywords: taxi trajectory, traffic flow, betweenness centrality, mobile phone data, spatial heterogeneity, distance decay
|
| [16] |
Travel time estimation for urban road networks using low frequency probe vehicle data [J].https://doi.org/10.1016/j.trb.2013.03.008 URL [本文引用: 1] 摘要
The paper presents a statistical model for urban road network travel time estimation using vehicle trajectories obtained from low frequency GPS probes as observations, where the vehicles typically cover multiple network links between reports. The network model separates trip travel times into link travel times and intersection delays and allows correlation between travel times on different network links based on a spatial moving average (SMA) structure. The observation model presents a way to estimate the parameters of the network model, including the correlation structure, through low frequency sampling of vehicle traces. Link-specific effects are combined with link attributes (speed limit, functional class, etc.) and trip conditions (day of week, season, weather, etc.) as explanatory variables. The approach captures the underlying factors behind spatial and temporal variations in speeds, which is useful for traffic management, planning and forecasting. The model is estimated using maximum likelihood. The model is applied in a case study for the network of Stockholm, Sweden. Link attributes and trip conditions (including recent snowfall) have significant effects on travel times and there is significant positive correlation between segments. The case study highlights the potential of using sparse probe vehicle data for monitoring the performance of the urban transport system.
|
| [17] |
Measuring potential physical accessibility to general practitioners in rural areas: A method and case study [J].https://doi.org/10.1016/0277-9536(82)90428-2 URL PMID: 7100960 摘要
The general practitioner is the key element within most rural health care delivery systems, virtually controlling referal to higher levels of care as well as providing basic care. In consequence of the progressive urban-based centralization of health care facilities and specialized personnel encouraged by the desire to take advantage of economies of scale in supply, the role of the general practitioner within rural health care delivery has become increasingly crucial. However, the supply of general practitioners in rural areas has not kept pace with demands, and accessibility to physicians has become a pressing issue in many rural areas. Although ‘accessibility’ is not taken to be synonymous with physical or geographical accessibility, the dispersed settlement characteristic of most rural areas elevates the latter to a position of primary importance. Following a discussion of the merits of measures of accessibility based upon utilization versus measures based upon the relative location of population and physicians, a measure on potential physical accessibility is presented and applied to a Canadian data set. The results suggest that although considerable differences in potential accessibility exist between rural areas near and far from urban centres, the smaller catchment populations of most rural general practitioners may partly compensate for isolation from major, urban concentrations of physicians.
|
| [18] |
A virtual vehicle probe model for time-dependent travel time estimation on signalized arterials [J].https://doi.org/10.1016/j.trc.2008.05.002 URL [本文引用: 1] 摘要
Estimation of time-dependent arterial travel time is a challenging task because of the interrupted nature of urban traffic flows. Many research efforts have been devoted to this topic, but their successes are limited and most of them can only be used for offline purposes due to the limited availability of traffic data from signalized intersections. In this paper, we describe a real-time arterial data collection and archival system developed at the University of Minnesota, followed by an innovative algorithm for time-dependent arterial travel time estimation using the archived traffic data. The data collection system simultaneously collects high-resolution “event-based” traffic data including every vehicle actuations over loop detector and every signal phase changes from multiple intersections. Using the “event-based” data, we estimate time-dependent travel time along an arterial by tracing a virtual probe vehicle. At each time step, the virtual probe has three possible maneuvers: acceleration, deceleration and no-speed-change. The maneuver decision is determined by its own status and surrounding traffic conditions, which can be estimated based on the availability of traffic data at intersections. An interesting property of the proposed model is that travel time estimation errors can be self-corrected, because the trajectory differences between a virtual probe vehicle and a real one can be reduced when both vehicles meet a red signal phase and/or a vehicle queue. Field studies at a 11-intersection arterial corridor along France Avenue in Minneapolis, MN, demonstrate that the proposed model can generate accurate time-dependent travel times under various traffic conditions.
|
| [19] |
Uncovering cabdrivers’ behavior patterns from their digital traces [J].https://doi.org/10.1016/j.compenvurbsys.2010.07.004 URL [本文引用: 1] 摘要
Recognizing high-level human behavior and decisions from their digital traces are critical issues in pervasive computing systems. In this paper, we develop a novel methodology to reveal cabdrivers’ operation patterns by analyzing their continuous digital traces. For the first time, we systematically study large scale cabdrivers’ behavior in a real and complex city context through their daily digital traces. We identify a set of valuable features, which are simple and effective to classify cabdrivers, delineate cabdrivers’ operation patterns and compare the different cabdrivers’ behavior. The methodology and steps could spatially and temporally quantify, visualize, and examine different cabdrivers’ operation patterns. Drivers were categorized into top drivers and ordinary drivers by their daily income. We use the daily operations of 3000 cabdrivers in over 48 million of trips and 240 million kilometers to uncover: (1) spatial selection behavior, (2) context-aware spatio-temporal operation behavior, (3) route choice behavior, and (4) operation tactics. Though we focused on cabdriver operation patterns analysis from their digital traces, the methodology is a general empirical and analytical methodology for any GPS-like trace analysis. Our work demonstrates the great potential to utilize the massive pervasive data sets to understand human behavior and high-level intelligence.
|
| [20] |
Understanding intra- urban trip patterns from taxi trajectory data [J]. |
| [21] |
Measuring spatial accessibility to primary care in rural areas: Improving the effectiveness of the two-step floating catchment area method [J].https://doi.org/10.1016/j.apgeog.2008.12.003 Magsci [本文引用: 1] 摘要
<h2 class="secHeading" id="section_abstract">Abstract</h2><p id="">Quantifying spatial accessibility in relation to the provision of rural health services has proven difficult. This article critically appraises the two-step floating catchment area (2SFCA) method, a recent solution for measuring primary care service accessibility across rural areas of Victoria, Australia. The 2SFCA method is demonstrated to have two fundamental shortcomings – specifically the use of only one catchment size for all populations, and secondly the assumption that proximity is undifferentiated within a catchment (especially problematic when the catchment is large). Despite its advantages over simple population-to-provider ratios, the 2SFCA method needs to be used with caution.</p>
|
| [22] |
Choice of hospital for delivery: A comparison of high-risk and low-risk women [J].https://doi.org/10.1093/heapol/8.2.184 URL PMID: 8514500 [本文引用: 1] 摘要
This article tests whether or not the factors that affect hospital choice differ for selected subgroups of the population.1985 California Office of Statewide Health Planning and Development (OSHPD) discharge abstracts and hospital financial data were used.Models for hospital choice were estimated using McFadden's conditional logit model. Separate models were estimated for high-risk and low-risk patients, and for high-risk and low-risk women covered either by private insurance or by California Medicaid. The model included independent variables to control for quality, price, ownership, and distance to the hospital.Data covered all maternal deliveries in the San Francisco Bay Area in 1985 (N = 61,436). ICD-9 codes were used to classify patients as high-risk or low-risk. The expected payment code on the discharge abstract was used to identify insurance status.The results strongly reject the hypothesis that high-risk and low-risk women have the same choice process. Hospital quality tended to be more important for high-risk than low-risk women. These results also reject the hypothesis that factors influencing choice of hospital are the same for women covered by private insurance as for those covered by Medicaid. Further, high-risk women covered by Medicaid were less likely than high-risk women covered by private insurance to deliver in hospitals with newborn intensive care units.The results show that the choice factors vary across several broadly defined subgroups of patients with a specific condition. Thus, estimates aggregating all patients may be misleading. Specifically, such estimates will understate actual patient response to quality of care indicators, since patient sensitivity to quality of care varies with the patients' risk status.
|
| [23] |
Paramedic response time: Does it affect patient survival [J]. |
| [24] |
The formation of the emergency medical services system [J].https://doi.org/10.2105/AJPH.2004.048793 URL PMID: 16449600 [本文引用: 1] 摘要
The evolution of the emergency medical services system in the United States accelerated rapidly between 1960 and 1973 as a result of a number of medical, historical, and social forces. Current emergency medical services researchers, policy advocates, and administrators must acknowledge these forces and their limitations and work to modify the system into one that provides uniformly high-quality acute care to all patients, improves the overall public health through injury control and disease prevention programs, participates as a full partner in disease surveillance, and is prepared to address new community needs of all types. (Am J Public Health. 2006;96:414-423.)
|
| [25] |
Location characteristics of inner-city neighborhoods and employment accessibility of low-wage workers [J].https://doi.org/10.1068/b250345 URL 摘要
Studies that examine spatial characteristics of urban unemployment are often based on some simplistic measures of employment accessibility. In this paper a refined methodological framework for measuring accessibility is presented, which enables the researcher (1) to improve the measurement by accounting for job competition among workers commuting by different modes, and (2) to understand the outcome more thoroughly by distinguishing the effect of location from that of workers' auto ownership. This refined framework is applied to a case study of employment accessibility of low-wage workers living in Boston's inner-city neighborhoods, with primarily 1990 Census demographic and journey-to-work data. The empirical results show clearly that, although the central location of inner-city residence still gives the low-wage workers some advantage, auto ownership is the more important determinant. Low-wage workers living in inner-city neighborhoods on average do not have high employment accessibility because a large percentage of them do not own any motor vehicle and hence have limited spatial mobility. Implications of the findings are discussed and qualified in light of the limitation of the research.
|
| [26] |
Multi-state and multi-sensor incident detection systems for arterial streets [J].https://doi.org/10.1016/S0968-090X(99)00003-0 URL [本文引用: 1] 摘要
To accomodate added detection states and the fusion of multi-sensor input vectors, this paper reformulates the arterial incident detection problem as a multiple attribute decision making problem with Bayesian scores. This novel approach utilizes as input the combinations of simulated probe travel times, number of probe reports, lane specific detector occupancies and vehicle counts. Models based solely on probe data lack in performance due to excessive overlaps in class distributions. Models based on detector occupancies and vehicle counts by lane perform outstandingly. They display a propensity to detect through lane measurement imbalances. The probe data is shown to enhance the performance of detector data based models.
|
| [27] |
Reliable real-time framework for short-term freeway travel time prediction [J].https://doi.org/10.1061/(ASCE)0733-947X(2006)132:12(921) [本文引用: 1] 摘要
It is widely acknowledged that traffic information has the potential of increasing the reliability in road networks and in alleviating congestion and its negative environmental and societal side effects. However, for these beneficial collective effects to occur, reliable and accurate traffic information is a prerequisite. Building on previous research, this article presents a reliable framework for online travel time prediction for freeways, which could, for example, be used to generate traffic information messages on so-called dynamic route information panels on freeways. Central in this framework is a so-called state-space neural network (SSNN) model, which learns to predict travel times directly from data obtained from real time traffic data collection systems. In this article we show that by using an ensemble of SSNN models also a measure for the reliability of each prediction can be produced. This enables traffic managers to monitor in real time the reliability of this system without actually measuring travel times.
|
| [28] |
Estimating the effect of turn penalties and traffic congestion on measuring spatial accessibility to primary health care [J].https://doi.org/10.1016/j.apgeog.2012.12.003 URL Magsci 摘要
Geographic variations in spatial accessibility to public resources, such as health care services, raise important questions about the efficiencies and inequities of the processes that determine where these services are located. Spatial accessibility can be measured many different ways, but many of methods in use today involve some measure of travel cost (in time or distance). In this study we explore a simple methodological question: how much are models of spatial accessibility influenced by the precise metric of travel cost? We address this question by comparing spatial accessibility to primary care physicians for two different methods of calculating travel cost (in time) on a street network: free-flow travel time and congested with turn penalties travel time which augments free-flow travel times with the burden of traffic congestion and traffic intersection controls. We consider the effect of these two metrics of travel cost on a gravity-based measure of spatial accessibility to primary health care services in Edmonton, Alberta, Canada. Our results suggest that while travel times between locations of demand and locations of primary care providers greatly differ based on how travel cost is calculated, the gravity-based measure of spatial accessibility provides similar information for both travel cost metrics. Using congested with turn penalties travel time can be an onerous addition to the analysis of spatial accessibility, and is more useful for measuring absolute travel time rather than modeling relative spatial accessibility. (C) 2012 Elsevier Ltd. All rights reserved.
|

/
| 〈 |
|
〉 |