孙云华 , 郭涛
, 郭涛
SUN Yunhua, GUO Tao
收稿日期: 2015-06-10
接受日期: 2015-11-10
网络出版日期: 2016-02-10
版权声明: 2016 地理科学进展 《地理科学进展》杂志 版权所有
基金资助:
作者简介:
作者简介:孙云华(1985-),女,山东临清人,博士生,主要从事土地利用变化研究,E-mail:yunhua07@163.com。
展开
摘要
在遥感、地理信息系统和统计定量分析结合的基础上,引进土地利用变化强度分析理论方法。作为一种解释性的数学框架,通过不同时间间隔的土地利用转移矩阵计算了每个时间间隔和每种地类的变化面积和变化强度。强度分析自上而下分为3个层次:间隔层次、地类层次和转变层次,将观察变化强度与平均变化强度比较,揭示不同层次的变化特征,并依次用快速的与缓慢的、活跃的与平稳的、来源与转变三对术语来描述。本文以昆明市的土地利用变化为例,深入阐述了不同层次的面积变化和强度变化,并对不同层次的稳定性进行了深入分析。结果表明:在间隔层次,2000年后昆明市的土地利用变化强度逐渐加大;在地类层次,建设用地的变化强度是最活跃的,林地的变化强度是最平稳的;在转变层次,增加的建设用地主要来源于耕地,减少的林地主要转变为草地。强度分析在土地利用变化过程分析中具有系统性的优势,对深入挖掘土地利用变化信息、理解土地利用变化过程具有重要作用。
关键词:
Abstract
Intensity analysis is a popular method as a top-down hierarchical accounting framework to analyze land use maps by considering cross-tabulation matrices and calculating change area and intensity of each land use category in every time interval with the use of remote sensing, geographic information system, and statistical methods. It was applied to analyze land use changes at three levels: temporal (time interval), categorical (land use types), and direction of conversion. At each level, we compared the observed change intensity to a uniform change intensity in order to reveal the characteristics of change. At the temporal level, we identify in which time intervals changes were relatively fast in terms of overall annual change. At the categorical level, we identify which categories were stable as opposed to active relative to the size of the categories. At the direction of conversion level, when a given category gains or loses, we can identify intensive targeting or avoidance of the other categories. In this article, we took land use change in Kunming City as an example to explore area and intensity changes at different levels and analyze stationarity. The results show that temporally land use intensity in Kunming City has gradually increased since 2000 (in the last time interval). With regard to land use categories, built-up areas’ change intensity was most active, while the change intensity of forests was most stable. With regard to the direction of conversion, the increased built-up areas were mainly from previous cropland, while the reduced forest areas were mainly changed into grassland. Intensity analysis theory has great advantages in analyzing land use change processes, which facilitates the mining of change information and understanding of land use change processes and is very useful for scientists.
Keywords:
土地利用变化是全球环境变化的主要研究内容,受到越来越多的重视(McMahon et al, 2005; Sterling et al, 2012; 张增祥等, 2012; Herrick et al, 2013; Mooney et al, 2013; 刘纪远等, 2014)。土地利用转移矩阵/关联表可全面而又具体地分析区域土地利用变化的数量结构特征与各地类变化的方向(何春阳等, 2001; Pontius Jr et al, 2004; Takada et al, 2010; Romero-Ruiz et al, 2012),因而在土地利用变化和模拟分析中具有重要意义,并得到了广泛应用(刘瑞等, 2010; 乔伟峰等, 2013)。但对关联表中的数据进行简单比较,直接分析土地利用类型面积的变化信息,并不能揭示土地利用变化过程中人类与环境之间的内在相互作用过程,也不能系统地对多个连续时间间隔形成的转移矩阵进行深入研究(Pontius et al, 2008; Romero-Ruiz et al, 2012)。为此,美国克拉克大学研究团队Aldwaik等(2012)首次提出了强度分析的概念,从系统论的角度出发,在间隔层次、地类层次和转变层次分别计算地类之间转换面积的强度大小。Pontius等(2013)从以下四个方面讨论了强度分析在土地利用过程中可解决的问题:①利用强度分析解释遥感影像解译地图上的分类错误;②分析在研究区占很大面积且表现为沉寂的地类对土地利用变化结果产生的影响;③利用强度分析的研究方法可有效地选取合适的研究区域;④对强度分析自上而下的分层等级框架进行解释,在一个时间间隔内地类变化大小取决于t+1时刻地类变化面积,而不是t时刻地类变化面积。强度分析每一个层次对观察变化强度和假设统一变化强度以及系统的稳定性进行了描述。目前,许多学者已利用Pontius等提出的强度分析方法进行了研究。Huang等(2012)和Zhou等(2014)把强度分析方法和土地利用变化过程联系起来,对中国东南沿海地区九龙江流域土地利用时空动态变化模式与变化过程进行了分析。Mallinis等(2014)利用强度分析在多个层次上对Parnitha和Penteli两个地区近62年的土地利用/植被覆盖变化(LUCC)进行了对比研究。
目前,强度分析理论已基本成熟,但尚未见到国内学者用此理论研究土地利用变化。本文以云南省昆明市的土地利用变化为例,阐述了土地利用变化强度分析3个层次的概念,对强度分析自上而下层级的解释性框架进行了分析描述,同时还对强度分析3个层次的稳定性进行了界定,将有助于研究者将图表与土地利用变化过程联系起来。昆明作为高原型城市,总体地形北部高,由北向南呈阶梯状逐渐降低,中部隆起,东西两侧较低(谭文彬等, 2009),导致土地利用变化方式的差异显著,与强度分析理论的3个层次关系紧密。因此,本文以昆明市为例,分析不同层次的土地利用变化强度及其稳定性,可以为国土资源部门合理开发利用土地资源提供科学依据,实现保护高原城市生态环境的目的。
昆明市是云南省省会,位于云南省中部,属于滇中盆地城市,也是中国西南地区的中心城市之一。地处102°10′E-103°40′E,24°23′N-26°33′N,土地总面积21011 km2。昆明市位于云贵高原,以湖盆岩溶高原地貌形态为主,红色山原地貌次之,大部分地区海拔1500~2800 m。昆明属低纬度高原山地季风气候,年平均气温15℃,年均日照2200 h,无霜期240 d以上,年均降水约1000 mm(张薇等,2014)。
利用中国科学院资源环境科学数据中心(http://www.resdc.cn/Default.aspx)提供的云南省1990年、2000年、2008年比例尺1:10万土地利用现状遥感监测数据为原始数据,裁切出昆明市的土地利用变化数据,采用一级分类体系,包括耕地、林地、草地、水域、建设用地和未利用地。这三期影像的土地利用一级类型综合评价精度达到94.3%以上,满足比例尺1:10万用户制图精度 (Liu, 2003, 2010)。
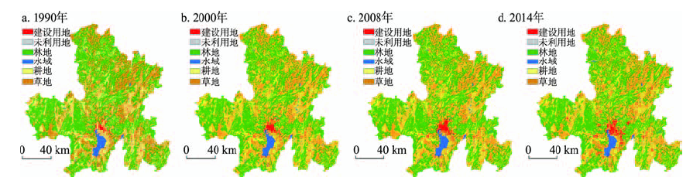
2014年土地利用变化数据采用Landsat8 OLI_TIRS卫星数据,下载自地理空间数据云平台(http://www.gscloud.cn/),轨道号分别为129/42、129/43、130/41、130/42、130/43,行号为129的影像采集时间为2014年4月23日,行号为130的影像采集时间为2014年4月14日,云量均小于1%。在2008年土地利用Coverage的基础上,利用2014年的遥感影像对比2008年变化部分予以修正,修正完成后在Arc模块中重建拓扑,形成2014年的Coverage,并对其进行验证,数据解译精度符合研究需要,最终在GIS软件的支持下建立各期空间属性数据库,并进行合并、提取、转化、叠置、量算等操作。经检验2014年数据的一级地类分类总精度为94%(表1),符合研究的精度要求。为了便于在IDRISI Selva 17.0软件中进行有效的研究,所有数据均处理成30 m×30 m分辨率,统一使用WGS1984坐标系和Krasovsky-1940-Albers投影。图1为昆明市4期土地利用变化数据。
表1 2014年遥感影像分类精度检验
Tab.1 Test of classification accuracy of remote sensing images in 2014
| 数据源 | 抽样数 | 分类正确数 | 判读精度 | Kappa |
|---|---|---|---|---|
| Landsat8-OLI-TIRS | 100 | 94 | 94% | 0.9012 |
强度分析是一种自上而下的分层等级的解释性框架结构,用于分析地类之间的变化差异(Pontius et al, 2013)。强度分析一方面给予直接的解释,另一方面对多个时期的遥感影像解译地图和多种土地利用类型进行了更深层次的理解。这种解释性框架得到了广泛的应用(Manandhar et al, 2010; Gitau et al, 2012)。它考虑多期遥感影像解译地图,从系统论的角度建立框架结构解释土地利用变化过程与人类和环境的变化影响。因此,强度分析包括3个层次:间隔层次、地类层次和转变层次。间隔层次通过对各个时期的遥感影像解译地图的总变化面积S和观察变化强度U进行计算,得出每个时间间隔变化在整个研究时间变化中是快速的还是缓慢的。地类层次是对某一个特定的时间间隔,分别针对地类的增加模式和减少模式,分析增加面积变化和相对应的强度变化大小以及减少面积变化和相对应的强度变化大小,并进一步分析每个地类总增加和总减少的变化面积和观察变化强度。转变层次是针对特定时间间隔内特定地类n的增加模式或者特定地类m的减少模式,对特定的地类转换为其他地类的面积和强度大小以及其他地类转换为这一特定地类的面积和强度大小进行计算,从而更进一步对转移矩阵的转变信息进行系统和详细的解释。
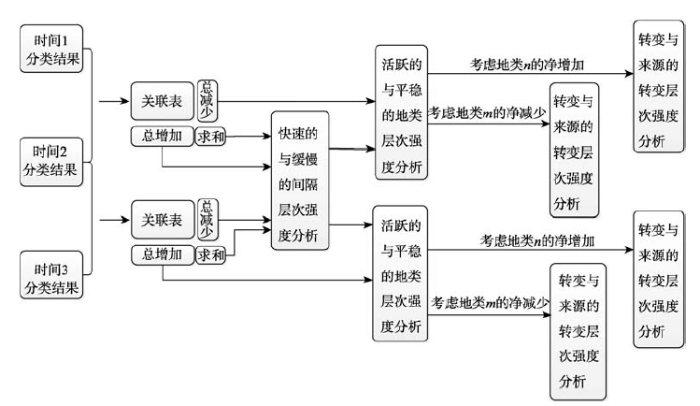
图2是强度分析技术流程图。对每个时间间隔的遥感影像解译结果作出每个连续时间间隔的关联表,沿着行的方向末端计算每个地类的总增加面积,沿着列的方向末端计算每个地类的总减少面积,在关联表的右下角计算每个时间间隔的总变化面积。通过比较每个时间间隔面积变化和强度变化,建立间隔层次的强度分析。同时也计算了多个层次的平均变化强度比率,称之为平均变化强度线或者平均变化强度。在间隔层次分别用每个时间间隔的观察变化强度与平均变化强度线作比较,如果某一时间间隔观察变化强度大于平均变化强度线,称该时间间隔变化强度是快速的,否则为缓慢的。同理,从地类层次计算了地类增加模式的面积变化、强度大小,以及地类减少模式的面积变化、强度大小,通过比较观察变化强度大小和平均变化强度线,如果某地类的观察变化强度大于平均变化强度线,称该地类是活跃的;反之则是平稳的。此外,从转变层次计算了特定地类n的增加模式和特定地类m的减少模式,利用类似的逻辑也比较特定地类的观察变化强度和平均变化强度线;如果特定地类的变化强度大于平均变化强度线,就认为该特定地类转变为其他地类,反之就来源于其他地类。强度分析的3个层次中,后面层次是对前面层次的详细解释,前面层次是对后面层次的补充;3个层次共同解释了土地利用变化过程和相互作用机制,也有助于将土地利用变化过程与图表联系起来。
对每个时间间隔的解译地图建立关联表后,在3个层次上形成了从概括到更详细的解释性框架,根据观察变化面积大小和强度大小分析了其不同层次的变化,目的是提取3个层次的变化信息。强度分析流程图2从左至右依次详细地解释了该方法的流程。
第一个层次称为“间隔层次”,分析了每个时间间隔的总变化,检查不同时间间隔的观察变化面积和观察变化强度。在计算每个时间间隔的观察变化强度之后,与平均变化强度比较,后者存在的条件是平均变化强度平均分配至整个时间间隔。
第二个层次称为“地类层次”,计算了每个地类随空间变化观察面积多少及观察变化强度的总减少和总增加。计算完每种地类的总减少和总增加变化强度之后,比较观察变化强度和平均变化强度,后者存在的条件是每个间隔内的平均变化强度平均分配至整个空间范围。
第三个层次称为“转变层次”,分析了特定地类的转变,以检查该转变在不同种类之间可用的观察转变变化面积大小和观察转变变化强度。当地类减少或增加时,通过比较每种转变的观察变化强度和平均变化强度,后者存在的条件是转变平均变化强度平均分配至所有转变可用的地类中,该层次的分析可以区分其他地类是否强烈转变为或来源于该转变。
3.2.1 间隔层次变化分析
在强度分析的间隔层次,假设了第一个研究问题:“在整体时间间隔中,哪个时间间隔的强度变化是相对缓慢的或快速的?”该部分给出两个公式用于回答第一个研究问题,式(1)定义了每个时间间隔内整个研究区的观察变化强度St,即T-1个时间间隔内年均变化速率,意味着每个时间间隔都存在一个变化速率St。式(2)给出了研究区域整个时间范围的平均变化强度,如果考虑整个变化速率时存在平均变化强度线,变化模式就是完全稳定。换言之,如果在所有的时间间隔内St相等,那么这些St值就等于U。这个逻辑是整个强度分析的前提,也应用于随后的地类和转变层次中。
3.2.2 地类层次变化分析
在地类层次假设了第二个研究问题:“在特定的时间间隔内,哪种地类是相对平稳的或活跃的?”。式(3)和(4)回答了这个问题,对于每个特定时间间隔,式(3)和(4)分别给出了地类的年均观察增加变化强度和年均观察减少变化强度,并为每种地类产生了一个输出结果。式(2)给出了时间间隔[Yt,Yt+1]内的平均变化强度,因此式(2)是间隔层次分析和地类层次分析的桥梁。如果对于所有地类j,平均变化强度U与观察增加变化强度Gtj值相等,则年均观察增加变化强度就等于St。类似的,如果对于所有地类i,平均变化强度U与Lti值相等,年均观察减少变化强度也会等于St。
本文还验证了地类层次的增加观察强度和减少观察强度在地类模式的时间间隔内是否稳定。对于地类层次的增加模式分析,将稳定性定义为地类的增加观察变化强度大于所有间隔的平均变化强度或者小于所有间隔的平均变化强度。类似的逻辑,如果地类的减少观察强度大于所有间隔的平均变化强度或者小于所有间隔的平均变化强度,则认为该地类在考虑减少观察强度时是稳定的。特定地类的强度可能从一个时间间隔变化到另一个时间间隔,但本文对稳定的定义仅考虑所有时间间隔的强度位于平均变化强度线的哪一侧。
3.2.3 转变层次变化分析
在转变层次,提出了第三个需要回答的研究问题为:“在特定的时间间隔内哪种转变是强烈的?”转变层次分析了从一个特定地类转变为另一种地类时的任意转变强度,同时解释了整个研究区域所有单个地类的变化面积大小。分析从地类m转变为不同的地类n的转变强度是稳定的。本节首先检查地类n的增加模式,然后考虑地类m的减少模式。
考虑地类n的观察增加模式,式(5)和(6)界定了在一个特定的时间间隔内,特定地类n的增加来源于或转变为非n地类。式(5)给出了在i≠n时,每种地类i转变为地类n的观察变化强度。式(5)在每个时间间隔内产生了J-1个强度,即在每个时间间隔内每种非n地类均会有一个观察变化强度。对于每个时间间隔,式(6)为每个地类n产生一个平均变化强度,定义为假设地类n在整个研究区内统一增加时,地类n的年均观察转变变化强度。式(6)的平均变化强度是式(2)解出的J-1个强度的加权平均,每个地类i的权重是地类i在时间间隔[Yt,Yt+1]的变化面积。那么式(6)的分母是式(5)的J-1个强度分母的求和。如果n在整个空间范围内是统一增加的,则对所有i而言,Rtin=Wtn。
在转变层次,通过调查所有时间间隔的观察变化强度,检查从地类m转变为地类n的稳定性。如果地类n的增加在所有时间间隔内都是转变为地类m,或者在所有时间间隔内都不是转变为地类m,则称为考虑地类n的增加时,从地类m转变为地类n时是稳定的。
为考虑地类m的减少观察变化面积和变化强度,式(7)和(8)分析了地类m的减少模式,类似于式(5)和(6)分析的地类n的增加模式。考虑到地类m的减少模式,式(7)和(8)界定了在一个特定的时间间隔内,地类m转变为其他地类是否强烈,式(7)给出了在j≠m时,地类m转变为其他地类时的观察变化强度。式(7)在每个时间间隔内产生了J-1个观察变化强度,意味着每个时间间隔内每种非m地类都会有一个观察变化强度。式(8)对每种地类m产生了一个输出结果,定义了地类m在每个时间间隔的后一个时间点上转变为其他地类的平均转变变化强度。这个平均转变强度描述了地类m转变为其他地类的情况,而所有非m地类的增加来自地类m,和后一时间点非m地类的相对大小是成比例的。如果地类m以一种统一方式减少为所有其他地类,那么对所有j而言,Qtmj=Vtm。
本文也定义了所有时间间隔的观察变化强度从地类m转为地类n的稳定性。如果地类m的减少在所有时间间隔内均转变为地类n,或者在所有时间间隔内均来源于地类n,则称为考虑地类m的减少时,地类m转变为地类n是稳定的。
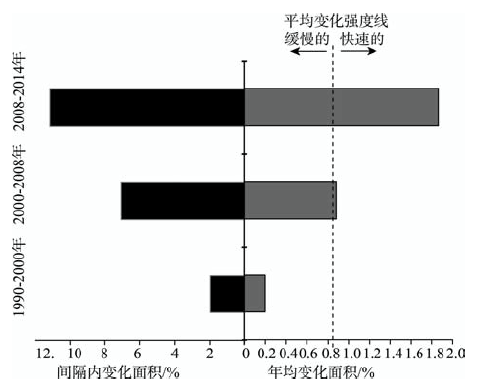
在间隔层次,如图3所示,图的右侧1990-2000年的变化强度小于平均变化强度,说明1990-2000年的变化强度是缓慢的。2008-2014年的变化强度大于平均变化强度,说明在这个时间间隔变化是快速的。2000-2008年的变化强度等于平均变化强度。从图3左侧的面积变化可以看出,面积变化和强度变化是基本成比例的,1990-2000年的变化面积最少,仅占研究区域的2%;2008-2014年的变化面积最多,占研究区域的11%。主要原因是云南省委省政府在2003年作出了加快现代新昆明发展的战略决策,提出了昆明市“一湖四环、一湖四片(城)”的空间战略构想,力争到2020年,城市建成规模达460 km2,城市人口450万(http://szfyjs.km.gov.cn/structure/dycg/zw_85203_1.htm)。
图3 昆明市间隔层次土地利用变化的面积变化和强度变化
Fig.3 Land use area and intensity changes in three time intervals in Kunming City
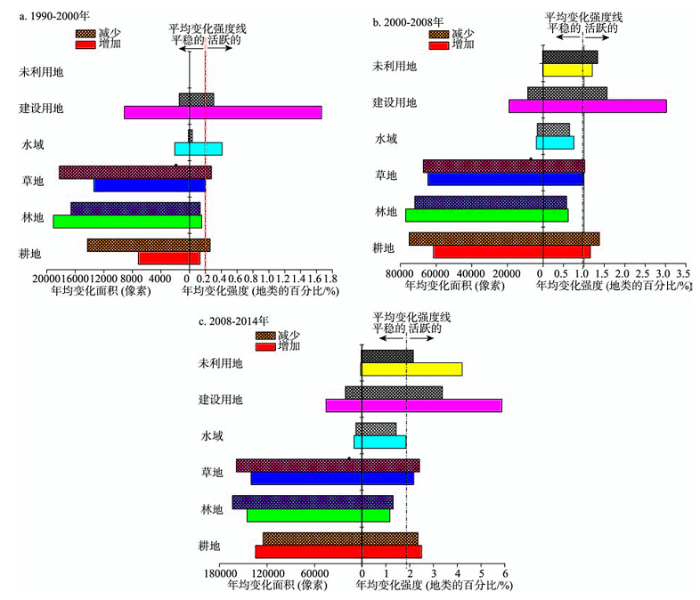
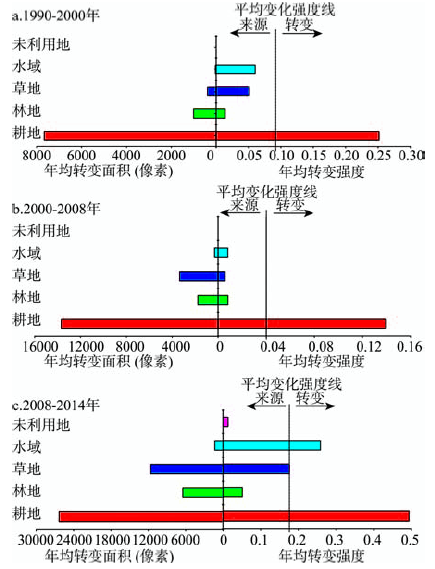
在地类层次,从图4右侧的变化强度来看,林地变化强度的增加和减少小于平均增加变化强度和平均减少变化强度,林地在整个时间间隔内都是平稳的。建设用地的增加变化强度和减少变化强度大于平均增加变化强度和平均减少变化强度,在整个时间间隔内都是活跃的。其他地类的增加变化强度或减少变化强度在3个时间间隔内表现为不同的强度变化趋势。根据地类层次稳定性的界定,在整个时间间隔内,建设用地的变化强度均大于平均变化强度,受交通因素、社会经济、政策和规划等因素的影响,昆明市建设用地持续扩张;而林地的变化强度均小于平均变化强度,是因为退耕还林、保护生态环境等政策措施的实施,林地变化微弱,因此建设用地和林地在整个时间间隔范围内是稳定的。
图4 昆明市地类层次土地利用变化的面积变化和强度变化
Fig.4 Area and intensity changes for six land use categories in Kunming City
从图4左侧的面积变化来看,林地的增加和减少面积在每个时间间隔内均是最大的,这和林地占研究区域的比重最大有关,林地在前两个时间间隔的增加面积大于减少面积,产生空间转换现象。草地在1990-2000年和2008-2014年的减少面积居其次,耕地在2000-2008年的减少面积大于草地的面积。对六种地类进行对比可以看出,建设用地的增加面积远大于减少面积,并且其强度也是最活跃的。这是因为自20世纪90年代起,随着经济迅速发展形成“开发区热”和“房地产热”的发展势头,并且2000年后西部大开发战略的实施,吸纳了大量的资金、人才和技术,使城镇扩展速度明显加快。变化强度的较活跃程度仅次于建设用地(刘纪远等, 2014)。
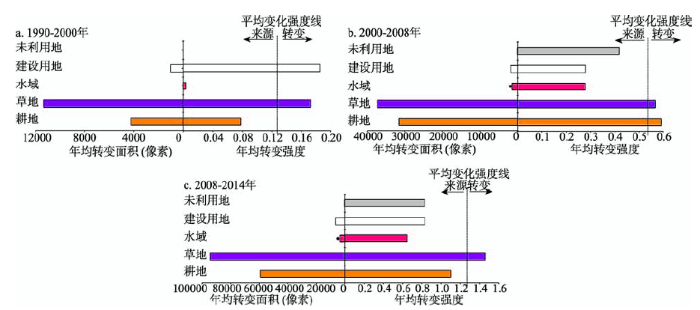
从转变层次的增加模式来看,以建设用地为例。如图5右侧所示,1990-2000年和2000-2008年,耕地的增加转变变化强度大于平均转变变化强度,建设用地的增加主要来源于耕地,而不是其他用地。2008-2014年,耕地、草地和水域的增加转变变化强度大于平均转变变化强度,建设用地的增加主要来源于耕地、草地和水域,原因是昆明市围绕滇池开发建设用地的强度增加。图5左侧的面积变化也说明建设用地的增加所占耕地面积最多,源于其他地类的面积较少。根据转变层次增加模式稳定性的界定,在3个时间间隔内,建设用地的增加均来源于耕地,而不是林地和未利用地,因此,从耕地转变为建设用地是稳定的,而林地和未利用地没有转变为建设用地的趋势也是稳定的。
图5 3个时间间隔内转变到建设用地的增加模式的面积变化和强度变化
Fig.5 Intensity analysis for conversion in to built-up areas based on the observed gains in three time intervals
从转变层次的减少模式来看,以林地为例(图6),可以看出,1990-2000年林地的减少转变为建设用地和草地,2000-2008年转变为草地和耕地,2008-2014年仅转变为草地。在3个时间间隔内林地的减少均转变为草地,这和草地所占面积比重较大有关。根据转变层次减少模式的稳定性界定,在3个时间间隔内,林地的减少均转变为草地是稳定的,不转变为未利用地和水域也是稳定的。
图6 3个时间间隔内林地转变为其他用地的减少模式的面积变化和强度变化
Fig.6 Intensity analysis for conversion from forest based on the observed losses in three time intervals
强度分析是一个自上而下的等级层次解释性数学框架,对系统性地深入理解土地利用变化过程具有重要意义。昆明市的地势复杂,由山地、丘陵和平坝组成,梯度性较显著,因此,较适合使用强度分析理论的3个层次来分析土地利用变化,和其他土地利用变化研究方法相比,更具系统性。本文的结论主要如下:
(1) 从变化强度来看,在间隔层次,昆明市在2000年后的土地利用变化强度逐渐加大。在地类层次,在整个时间间隔范围内,建设用地的增加强度和减少强度均是活跃的,林地的增加强度和减少强度均是平稳的,其他地类的增加强度或减少强度表现不一。在转变层次,建设用地的增加主要来源于耕地,在2008-2014年还来源于水域,而不是其他地类;林地的减少主要转变为草地。
(2) 从变化面积来看,在间隔层次,1990-2000年变化面积最少,2008-2014年变化面积最多。在地类层次,年均变化面积较多的土地利用类型是林地、草地、耕地,未利用地年均变化面积最少,建设用地的增加面积远大于减少面积。在转变层次,建设用地的增加面积主要来自耕地的减少面积,林地的减少面积主要转变为草地,其次是耕地。
(3) 从3个层次的稳定性来看,间隔层次是不稳定的。地类层次仅有建设用地和林地是稳定的,其他地类是不稳定的。转变层次,在考虑建设用地的增加时,从耕地转变为建设用地是稳定的,来源于未利用地、草地、林地也是稳定的;在考虑林地的减少时,转变为草地是稳定的,来源于未利用地和水域也是稳定的。
(4) 利用强度分析与国内外流行的分析土地利用变化过程的Markov模型 (Bell et al, 1997; Mertens et al, 2000; Pelorosso et al, 2011)进行对比,Markov模型结构假设是一个自下而上的过程,Markov每一行的转变强度决定了整个时间间隔的变化过程,它计算了t时刻转变为t+1时刻的地类比例,且t时刻地类的转变大小与其他地类在t时刻转变地类大小无关。与强度分析地类层次的增加模式和减少模式相比,Markov模型只考虑了特定地类的增加转变强度。同时与强度分析的特定增加地类相比较,Markov模型没有考虑关联表中每一列的转变分布情况,忽略了关联表中每一列不同层次之间相互联系的转变强度变化和转变面积大小。可以看出,强度分析在分析土地利用变化过程时更具系统性的优势。
(5) 强度分析是一个对土地利用变化过程分析的有效方法,下一步工作是把强度分析的多个层次的强度变化大小进行时空表达,在空间上可以清楚看到各个层次的强度在在空间范围的变化情况。此外还把各个层次转变面积大小和变化强度表达在同一个地图上,可以深入了解每个层次变化面积和变化强度的空间分布趋势。
致谢:感谢美国克拉克大学地理学院 Robert Gilmore Pontius Jr教授给予关指导和提出宝贵意见;以及中国科学院遥感与数字地球研究所张增祥研究员提出的宝贵意见。
The authors have declared that no competing interests exist.
| [1] |
北京地区土地利用/覆盖变化研究 [J].
<p>本文利用1975、1984、1991和1997的LandsatTM/MSS数据,对北京地区改革开放以来22年的土地利用/覆盖变化进行了研究。结果表明从1975~1997年,北京地区发生了快速城市化背景下的大规模土地利用/覆盖变化,表现出城镇用地通过大量占用平原区耕地扩展,非城镇用地间结构变化明显的基本特征。同时土地利用/覆盖变化区域差异明显,近郊区和远郊区的土地利用/覆盖变化强度发生了逆转,远郊区土地利用/覆盖变化强度在90年代已经超过近郊区,而且该区高密度城镇用地的重心也向西北方向发生了一定程度的移动,显示出同期北京城镇用地向西北方向扩展的趋势</p>
A study on land use/cover change in Beijing area [J].
<p>本文利用1975、1984、1991和1997的LandsatTM/MSS数据,对北京地区改革开放以来22年的土地利用/覆盖变化进行了研究。结果表明从1975~1997年,北京地区发生了快速城市化背景下的大规模土地利用/覆盖变化,表现出城镇用地通过大量占用平原区耕地扩展,非城镇用地间结构变化明显的基本特征。同时土地利用/覆盖变化区域差异明显,近郊区和远郊区的土地利用/覆盖变化强度发生了逆转,远郊区土地利用/覆盖变化强度在90年代已经超过近郊区,而且该区高密度城镇用地的重心也向西北方向发生了一定程度的移动,显示出同期北京城镇用地向西北方向扩展的趋势</p>
|
| [2] |
20世纪80年代末以来中国土地利用变化的基本特征与空间格局 [J].https://doi.org/10.11821/dlxb201401001 URL Magsci [本文引用: 2] 摘要
土地利用/土地覆被变化(LUCC)是人类活动与自然环境相互作用最直接的表现形式,本文采用相同空间分辨率的卫星遥感信息源和相同的技术方法,对中国1980 年代末到2010 年土地利用变化数据进行定期更新。在此基础上,提出并发展土地利用动态区划的方法,研究土地利用变化的空间格局与时空特征。我们发现:1990-2010 年的20 年间,中国土地利用变化表现出明显的时空差异。“南减北增,总量基本持衡,新增耕地的重心逐步由东北向西北移动”是耕地变化的基本特征;“扩展提速,东部为重心,向中西部蔓延”是城乡建设用地变化的基本特征;“林地前减后增,荒漠前增后减,草地持续减少”是非人工土地利用类型变化的主要特征。20 世纪末与21 世纪初两个10 年相比,中国土地利用变化空间格局出现了一些新特征,原有的13 个土地利用变化区划单元演变为15 个单元,且部分区划单元边界发生变化。主要变化格局特征为黄淮海地区、东南部沿海地区、长江中游地区和四川盆地城镇工矿用地呈现明显的加速扩张态势;北方地区耕地开垦重心由东北地区和内蒙古东部转向西北绿洲农业区;东北地区旱作耕地持续转变为水田;内蒙古农牧交错带南部、黄土高原和西南山地退耕还林还草效果初显。近20 年间,尽管气候变化对北方地区的耕地变化有一定的影响,但政策调控和经济驱动仍然是导致我国土地利用变化及其时空差异的主要原因。2000 年后的第一个10 年,土地利用格局变化的人为驱动因素已由单向国土开发为主,转变为开发与保护并重。在空间格局变化的分析方法方面,应用“动态区划法”开展世纪之交两个10 年中国LUCC空间格局变化的分析,有效揭示了20 年来中国LUCC“格局的变化过程”,即动态区划边界的推移、区划单元内部特征的变化与单元的消长等;以及“变化过程的格局”,即土地利用变化过程与特征的分阶段区域差异,清晰刻画了LUCC动态区划中区划单元的消长,单元边界的变动,以及前后10 年的变化强度特征,揭示了土地利用“格局”与“过程”之间的交替转化规律,以及不同类型和区域的变化原因,证明了该分析方法的有效性。
Spatiotemporal characteristics, patterns and causes of land use changes in China since the late 1980s [J].https://doi.org/10.11821/dlxb201401001 URL Magsci [本文引用: 2] 摘要
土地利用/土地覆被变化(LUCC)是人类活动与自然环境相互作用最直接的表现形式,本文采用相同空间分辨率的卫星遥感信息源和相同的技术方法,对中国1980 年代末到2010 年土地利用变化数据进行定期更新。在此基础上,提出并发展土地利用动态区划的方法,研究土地利用变化的空间格局与时空特征。我们发现:1990-2010 年的20 年间,中国土地利用变化表现出明显的时空差异。“南减北增,总量基本持衡,新增耕地的重心逐步由东北向西北移动”是耕地变化的基本特征;“扩展提速,东部为重心,向中西部蔓延”是城乡建设用地变化的基本特征;“林地前减后增,荒漠前增后减,草地持续减少”是非人工土地利用类型变化的主要特征。20 世纪末与21 世纪初两个10 年相比,中国土地利用变化空间格局出现了一些新特征,原有的13 个土地利用变化区划单元演变为15 个单元,且部分区划单元边界发生变化。主要变化格局特征为黄淮海地区、东南部沿海地区、长江中游地区和四川盆地城镇工矿用地呈现明显的加速扩张态势;北方地区耕地开垦重心由东北地区和内蒙古东部转向西北绿洲农业区;东北地区旱作耕地持续转变为水田;内蒙古农牧交错带南部、黄土高原和西南山地退耕还林还草效果初显。近20 年间,尽管气候变化对北方地区的耕地变化有一定的影响,但政策调控和经济驱动仍然是导致我国土地利用变化及其时空差异的主要原因。2000 年后的第一个10 年,土地利用格局变化的人为驱动因素已由单向国土开发为主,转变为开发与保护并重。在空间格局变化的分析方法方面,应用“动态区划法”开展世纪之交两个10 年中国LUCC空间格局变化的分析,有效揭示了20 年来中国LUCC“格局的变化过程”,即动态区划边界的推移、区划单元内部特征的变化与单元的消长等;以及“变化过程的格局”,即土地利用变化过程与特征的分阶段区域差异,清晰刻画了LUCC动态区划中区划单元的消长,单元边界的变动,以及前后10 年的变化强度特征,揭示了土地利用“格局”与“过程”之间的交替转化规律,以及不同类型和区域的变化原因,证明了该分析方法的有效性。
|
| [3] |
基于转移矩阵的土地利用变化信息挖掘方法探讨 [J].
土地利用变化是全球变化中的重要组成部分。本文以土地利用转移矩阵为基础,构建了土地利用净变化量、交换变化量、总变化量的计算方法,并计算了随机状态下各地类间相互转换的理论频数,通过实际转换量与理论转换量进行对比,构建判断土地利用转换规则的方法,从而能够更加清晰地判断土地利用变化的系统过程。应用上述方法对山东省德州市临邑县土地利用变化进行了实证分析,结果显示:临邑县耕地总变化量最大,其次是园林地和未利用地,最后是建设用地和其他土地,其中耕地几乎全部都是交换变化,而未利用地则相反,园林地和其他土地以交换变化为主,建设用地以净变化为主;从新增的角度来说,未利用地转化为其他土地最具有转换优势,其次是未利用地转换为园林地;从流失的去向看,其他土地转换为园林地最具转换优势,其次是耕地转换为园林地。结果表明该方法可以有效获取各土地利用类型动态变化信息,更清晰地辨别土地利用类型间的转换规则,能够为土地利用空间分析和建模提供更有用的信息。
Methods for detecting land use changes based on the land use transition matrix [J].
土地利用变化是全球变化中的重要组成部分。本文以土地利用转移矩阵为基础,构建了土地利用净变化量、交换变化量、总变化量的计算方法,并计算了随机状态下各地类间相互转换的理论频数,通过实际转换量与理论转换量进行对比,构建判断土地利用转换规则的方法,从而能够更加清晰地判断土地利用变化的系统过程。应用上述方法对山东省德州市临邑县土地利用变化进行了实证分析,结果显示:临邑县耕地总变化量最大,其次是园林地和未利用地,最后是建设用地和其他土地,其中耕地几乎全部都是交换变化,而未利用地则相反,园林地和其他土地以交换变化为主,建设用地以净变化为主;从新增的角度来说,未利用地转化为其他土地最具有转换优势,其次是未利用地转换为园林地;从流失的去向看,其他土地转换为园林地最具转换优势,其次是耕地转换为园林地。结果表明该方法可以有效获取各土地利用类型动态变化信息,更清晰地辨别土地利用类型间的转换规则,能够为土地利用空间分析和建模提供更有用的信息。
|
| [4] |
基于转移矩阵的高度城市化区域土地利用演变信息挖掘: 以江苏省苏州市为例 [J].
深入分析土地利用转移矩阵和地类转移概率矩阵,提出利用连续分时段土地利用转移矩阵求算总时段转移矩阵的方法,进而改进地类变化量和地类动态度计算模型,提出了地类转移无序度的概念、含义并构造计算模型。以苏州市为例进行实证分析,结果显示:1999-2008 年苏州市耕地的总变化量最大,其次是其它农用地和独立工矿用地;其中耕地和独立工矿用地的主导变化是净变化,而其它农用地以交换变化为主;10 年间位列各地类动态度前三位的依次为独立工矿用地、其它农用地和建制镇用地,综合动态度在2004 年和2002 年最大,1999-2001 年较低;地类转移无序度的前二位是其它农用地和交通运输用地,其它地类该值均不高,说明苏州市10 年间的土地利用演化较为有序。研究表明,基于转移矩阵的相关模型的改进和构造深入挖掘了土地利用演变信息,有利于对土地利用变化进行深入研究。
Land use change information mining in highly urbanized area based on transfer matrix: A case study of Suzhou, Jiangsu Province [J].
深入分析土地利用转移矩阵和地类转移概率矩阵,提出利用连续分时段土地利用转移矩阵求算总时段转移矩阵的方法,进而改进地类变化量和地类动态度计算模型,提出了地类转移无序度的概念、含义并构造计算模型。以苏州市为例进行实证分析,结果显示:1999-2008 年苏州市耕地的总变化量最大,其次是其它农用地和独立工矿用地;其中耕地和独立工矿用地的主导变化是净变化,而其它农用地以交换变化为主;10 年间位列各地类动态度前三位的依次为独立工矿用地、其它农用地和建制镇用地,综合动态度在2004 年和2002 年最大,1999-2001 年较低;地类转移无序度的前二位是其它农用地和交通运输用地,其它地类该值均不高,说明苏州市10 年间的土地利用演化较为有序。研究表明,基于转移矩阵的相关模型的改进和构造深入挖掘了土地利用演变信息,有利于对土地利用变化进行深入研究。
|
| [5] |
近三十年来昆明市建成区扩展遥感监测与分析 [J].
以遥感影像为数据源,借助GIS技术提取了6个时期的昆明市建成区扩展及对周边土地占用的信息.在此基础上,利用扩展弹性系数、分形维数等方法分析了昆明市1974~2004年建成区扩展的时空特征、土地利用类型演变过程,以及与人口增长之间的协调关系,并应用相关分析和主成分分析方法,对影响昆明市建成区扩展的社会经济因素进行分析.结果表明:30年来昆明市建成区扩展了3.07倍,1974~1988年的14年间,仅增加了13.36km<sup>2</sup>,而1988~2004年的16年,增加了144.07km<sup>2</sup>.其增长速度与市区人口增长速度相比,有时超前有时滞后.建成区是以老城区为核心沿东北、西南、东南三个方向呈“星形”扩展.其扩展占用的土地主要是耕地.自然因素对建成区的扩展形态起着限制作用,社会经济因素是建成区扩展的内在推动力,政策和规划对建成区扩展起着引导和促进作用.
Remote sensing monitoring and analyzing of the urban built-up land expansion in Kunming in 1974-2004 [J].
以遥感影像为数据源,借助GIS技术提取了6个时期的昆明市建成区扩展及对周边土地占用的信息.在此基础上,利用扩展弹性系数、分形维数等方法分析了昆明市1974~2004年建成区扩展的时空特征、土地利用类型演变过程,以及与人口增长之间的协调关系,并应用相关分析和主成分分析方法,对影响昆明市建成区扩展的社会经济因素进行分析.结果表明:30年来昆明市建成区扩展了3.07倍,1974~1988年的14年间,仅增加了13.36km<sup>2</sup>,而1988~2004年的16年,增加了144.07km<sup>2</sup>.其增长速度与市区人口增长速度相比,有时超前有时滞后.建成区是以老城区为核心沿东北、西南、东南三个方向呈“星形”扩展.其扩展占用的土地主要是耕地.自然因素对建成区的扩展形态起着限制作用,社会经济因素是建成区扩展的内在推动力,政策和规划对建成区扩展起着引导和促进作用.
|
| [6] |
基于CLUE-S模型的昆明市域土地利用预案模拟 [J].
<p>模型方法在分析、模拟和预测土地利用变化中发挥着重要的作用。本文基于遥感方法得到1986、1996和2006年昆明市域土地利用图,在GIS技术的支持下对CLUE-S模型在地形复杂的昆明区域的适用性进行了评价。在考虑不同政策和发展趋势的影响下,设定了3个预案对昆明市域2007—2020年的土地利用进行了模拟。结果表明:CLUE-S模型在20年的时间尺度内能够较好模拟昆明市的土地利用变化。“历史发展趋势预案”下,作为研究区景观基质的林地面积将不断减少,建设用地和草地面积将不断增加,景观破碎化程度不断加剧;“规划预案”下,建设用地上升最快,耕地和林地面积下降,景观格局破碎化的趋势比历史发展趋势下有所放缓;“生态优先预案”下,林地面积不断上升,耕地和草地面积下降,景观格局将向着优化的方向发展。CLUE-S模型模拟结果能够对区域规划和相关土地利用政策制定提供有力的技术手段和科学支撑。</p>
Land-use scenarios simulation based on the CLUE-S model in Kunming [J].
<p>模型方法在分析、模拟和预测土地利用变化中发挥着重要的作用。本文基于遥感方法得到1986、1996和2006年昆明市域土地利用图,在GIS技术的支持下对CLUE-S模型在地形复杂的昆明区域的适用性进行了评价。在考虑不同政策和发展趋势的影响下,设定了3个预案对昆明市域2007—2020年的土地利用进行了模拟。结果表明:CLUE-S模型在20年的时间尺度内能够较好模拟昆明市的土地利用变化。“历史发展趋势预案”下,作为研究区景观基质的林地面积将不断减少,建设用地和草地面积将不断增加,景观破碎化程度不断加剧;“规划预案”下,建设用地上升最快,耕地和林地面积下降,景观格局破碎化的趋势比历史发展趋势下有所放缓;“生态优先预案”下,林地面积不断上升,耕地和草地面积下降,景观格局将向着优化的方向发展。CLUE-S模型模拟结果能够对区域规划和相关土地利用政策制定提供有力的技术手段和科学支撑。</p>
|
| [7] |
|
| [8] |
Intensity analysis to unify measurements of size and stationarity of land changes by interval, category, and transition [J].https://doi.org/10.1016/j.landurbplan.2012.02.010 URL 摘要
This article presents a quantitative method to analyze maps of land categories from several points in time for a single site by considering cross-tabulation matrices, where one matrix summarizes the change in each time interval. There are three levels of analysis, starting from general to more detailed levels, where each level exposes different types of information given the previous level of analysis. First, the interval level examines how the size and speed of change vary across time intervals. Second, the category level examines how the size and intensity of gross losses and gross gains in each category vary across categories for each time interval. Third, the transition level examines how the size and intensity of a category's transitions vary across the other categories that are available for that transition. At each level, the method tests for stationarity of patterns across time intervals. The unique contribution of this article is that it combines all three levels of analysis into one unified framework that we call intensity analysis, where the more detailed levels are conditional on the less detailed levels. The illustrative case study is for seven categories at the Plum Island Ecosystems site in northeastern Massachusetts, USA, where the largest transition is from Forest to Built during 1985, 1991, and 1999. We compare our approach to other established methods such as the Markov approach in order to show how our proposed intensity analysis gives more information concerning five possible reasons to explain why the transitions vary across time and space.
|
| [9] |
Markov analysis of land use change: continuous time and stationary processes [J].https://doi.org/10.1016/0038-0121(77)90041-6 URL [本文引用: 1] |
| [10] |
Multi-Layer assessment of land use and related changes for decision support in a coastal zone watershed [J].https://doi.org/10.3390/land1010005 URL [本文引用: 1] 摘要
In order to address the challenges in coastal regions, there is the need to understand the extent and impacts of past changes and their implications for future management. Land use data and remotely-sensed imagery are often used to provide insights into these changes. Often, however, existing land use data are inconsistent, thus differences observed through their analyses could also be attributable to error. The use of multiple layers of data, in addition and as related to basic land use layers, has been suggested in the literature as a method to mitigate such error. This study used existing land use data, population, stream flow, climate and water quality data with a view to determining what information could be discerned from multi-layer analyses and whether or how it could be used in watershed-level management decision making. Results showed that all the datasets provided useful, but not necessarily complemental, insights into spatial and temporal changes occurring in the watershed. The information obtained did, however, provide a broader perspective on watershed dynamics, which would be useful for watershed-level decision making. Overall, the multi-layer approach was found suitable in the absence of consistent land use data, provided results were interpreted in context, considering the historical perspective and with a working knowledge of the watershed.
|
| [11] |
The global land-potential knowledge system (landPKS): supporting evidence-based, site-specific land use and management through cloud computing, mobile applications, and crowd sourcing [J].https://doi.org/10.2489/jswc.68.1.5A URL [本文引用: 1] 摘要
Nitrogen (N) is critical for maintaining crop yields; however, current agricultural management practices are major contributors to high levels of N and other agricultural chemicals leaking into neighboring water bodies thereby limiting the achievement of sustainability goals for water resources. Changes in farmer beliefs over time about sustainability goals and production inputs reveal increasing uncertainty about the connection between sustainability and their practices. Inference from a multinomial model analysis of farmer beliefs from 1989 to 2002 shows increasing odds of being uncertain about whether use of sustainable farming practices help maintain the natural resource base. Almost 29% of the population of a 2002 random sample survey of Iowa farmers was uncertain about sustainable farming practices compared to 18.8% in 1989. Further, farmers were increasingly uncertain over time as to whether modern farming relies too heavily upon commercial fertilizers, insecticides, and herbicides. In 2002, 14.5% of farmers, compared to 8.4% in 1994 and 5.7% in 1989, were uncertain about whether heavy reliance on commercial fertilizers was a sustainability problem. Multinomial logistic regression models examining responses to various farming practices reveal that the ratio of disagree/agree increases over time and is influenced by total corn and soybean acres farmed, net of farmer age, and weather conditions. Models of uncertainty controlling for age and weather conditions show increasing farmer uncertainty about sustainable farming practices; natural resource base maintenance; and whether modern farming relies too heavily on commercial fertilizers, insecticides, and herbicides.
|
| [12] |
Use of intensity analysis to link patterns with processes of land change from 1986 to 2007 in a coastal watershed of southeast China [J].https://doi.org/10.1016/j.apgeog.2012.01.001 URL 摘要
This paper characterizes transitions among three land categories during three consecutive time intervals in a subtropical coastal watershed of southeast China that has enormous influence on the region鈥檚 economic and ecological health. Landsat Thematic Mapper satellite imagery of 1986, 1996, 2002, and 2007 were used to create maps of each time point for three categories: Agriculture, Natural, and Built. Intensity analysis was applied to quantify the annual intensity of the changes at three levels: time interval, category, and transition. The results show that overall land transformation is accelerating across the three time intervals. Agriculture shows net gain in the first time interval, then net losses in the subsequent two time intervals. The swap change is larger than the net change for both Agriculture and Natural during all three time intervals. Nearly all of the changes are exchanges between Agriculture and Natural areas. Agriculture and Built are active categories, whereas Natural is a dormant category during all three time intervals. The changes are stationary for all three time intervals in terms of the intensities of categories and transitions for Natural to Agriculture, Agriculture to Natural, and Agriculture to Built. The transition from Agriculture to Built is intensively systematic. The land-cover change is associated with the overall economic growth and recent agricultural decline of the area. The intensity analysis in the Jiulong River watershed reveals information that links patterns to processes of land-use and land-cover changes that are common in many other urbanizing places in China.
|
| [13] |
Study on spatial pattern of land-use change in China during 1995-2000 [J].https://doi.org/10.1360/03yd9033 URL [本文引用: 1] 摘要
Land-use/cover change has become an event being of paramount importance to the study of global environmental change[1,2]. Land-cover change is closely related to the terrestrial surface material cycles and life-support processes[3], i.e., the interaction
|
| [14] |
Spatial patterns and driving forces of land use change in China during the early 21st century [J].https://doi.org/10.1007/s11442-010-0483-4 URL Magsci 摘要
<p>Land use and land cover change as the core of coupled human-environment systems has become a potential field of land change science (LCS) in the study of global environmental change. Based on remotely sensed data of land use change with a spatial resolution of 1 km × 1 km on national scale among every 5 years, this paper designed a new dynamic regionalization according to the comprehensive characteristics of land use change including regional differentiation, physical, economic, and macro-policy factors as well. Spatial pattern of land use change and its driving forces were investigated in China in the early 21st century. To sum up, land use change pattern of this period was characterized by rapid changes in the whole country. Over the agricultural zones, e.g., Huang-Huai-Hai Plain, the southeast coastal areas and Sichuan Basin, a great proportion of fine arable land were engrossed owing to considerable expansion of the built-up and residential areas, resulting in decrease of paddy land area in southern China. The development of oasis agriculture in Northwest China and the reclamation in Northeast China led to a slight increase in arable land area in northern China. Due to the “Grain for Green” policy, forest area was significantly increased in the middle and western developing regions, where the vegetation coverage was substantially enlarged, likewise. This paper argued the main driving forces as the implementation of the strategy on land use and regional development, such as policies of “Western Development”, “Revitalization of Northeast”, coupled with rapidly economic development during this period.</p>
|
| [15] |
Monitoring land use/land cover transformations from 1945 to 2007 in two peri-urban mountainous areas of Athens metropolitan area, Greece [J].https://doi.org/10.1016/j.scitotenv.2014.04.129 URL PMID: 24858224 摘要
We discussed these LULC changes and associated them with human interference (activity) and other major socio-economic developments that were simultaneously occurring in the area. The different patterns of change of the areas, despite their geographical proximity, throughout the period of analysis imply that site-specific studies are needed in order to comprehensively assess the driving forces and develop models of landscape transformation in Mediterranean areas.
|
| [16] |
Analysis of twenty years of categorical land transitions in the lower Hunter of New South Wales, Australia [J].https://doi.org/10.1016/j.agee.2009.10.016 URL [本文引用: 1] 摘要
ABSTRACT Land use and land cover change (LUCC) studies are drawing increased attention due to their importance in ecosystem management. Post-classification change detection provides a “from-to” change matrix; however, traditional analysis of the change matrix is not sufficient to provide systematic signals of LUCC. This paper analyzes the details of the matrix to compute the quantity, allocation, and dominant signals of land use and land cover (LULC) transitions in a popular tourist destination, the Lower Hunter of New South Wales, Australia. We use classified maps that were derived from Landsat imageries of 1985 and 2005. We applied a change detection analysis based on an extended transition matrix of the two classified maps, and extracted systematic transitions. We then explored how changes are influenced by the resolution of the maps. The net quantity change less than 7% of the study area, while the total change is more than 28%, the latter due to considerable swap changes. Multiple-resolution analysis reveals that about half of the total change is attributable to spatial reallocation of the categories over distances less than 2.3 km. Vineyard has experienced substantial changes in terms of gross gains and gross losses, in spite of its small net change. The three transitions: Pasture/scrubland to Vineyard, Vineyard to Pasture/scrubland and Vineyard to Built-up are the systematic transitions in the landscape. The transition of Vineyard to Built-up around the centre of the study area and the expansion of Vineyard away from centre is associated with tourism, which is also extending into the new outer vineyards and wineries. This in-depth analysis has enabled us to quantify and to visualize the major signals of transitions of LULC categories in the study region.
|
| [17] |
Geography for a changing word: a science strategy for the geographic research of the U.S. geological survey, 2005-2015 [R]. |
| [18] |
Land-cover-change trajectories in southern Cameroon [J].https://doi.org/10.1111/0004-5608.00205 URL [本文引用: 1] 摘要
The objective of this study is to better understand the complexity of deforestation processes in southern Cameroon by testing a multivariate, spatial model of land-cover change trajectories associated with deforestation. The spatial model integrates a spectrum of independent variables that characterize land rent on a spatially explicit basis. The use of a time series of high-spatial-resolution remote sensing images (Landsat MSS and SPOT XS), spanning two decades, allows a thorough validation of spatial projections of future deforestation. Remote sensing observations reveal a continuous trend of forest clearing and forest degradation in southern regions of Cameroon, but with a highly fluctuating rate. A significant proportion of the areas subject to a land-cover conversion experienced other changes in the following years. The study also demonstrates that modeling land-cover change trajectories over several observation years allows a better projection of areas with a high probability of change in land-cover than projecting such areas on the basis of observations from the previous time period alone. Statistical results suggest that, in our southern Cameroon study area, roads mostly increased the accessibility of the forest for migrants rather than providing incentives for a transformation of local subsistence agriculture into market-oriented farming systems. The spatial model developed in this study allows simulations of likely impacts of human actions, leading to a transformation of the landscape (e.g., road projects) on key landscape attributes (e.g., biodiversity). Currently, several road projects or major logging concessions exist in southern Cameroon.
|
| [19] |
Evolution of natural and social science interactions in global change research programs [J].https://doi.org/10.1073/pnas.1107484110 URL [本文引用: 1] 摘要
Efforts to develop a global understanding of the functioning of the Earth as a system began in the mid-1980s. This effort necessitated linking knowledge from both the physical and biological realms. A motivation for this development was the growing impact of humans on the Earth system and need to provide solutions, but the study of the social drivers and their consequences for the changes that were occurring was not incorporated into the Earth System Science movement, despite early attempts to do so. The impediments to integration were many, but they are gradually being overcome, which can be seen in many trends for assessments, such as the Intergovernmental Platform on Biodiversity and Ecosystem Services, as well as both basic and applied science programs. In this development, particular people and events have shaped the trajectories that have occurred. The lessons learned should be considered in such emerging research programs as Future Earth , the new global program for sustainability research. The transitioning process to this new program will take time as scientists adjust to new colleagues with different ideologies, methods, and tools and a new way of doing science.
|
| [20] |
Stability analysis for defining management strategies in abandoned mountain landscapes of the Mediterranean basin [J].https://doi.org/10.1016/j.landurbplan.2011.08.007 URL PMID: 15473227 [本文引用: 1] 摘要
The semi-natural landscapes of Mediterranean mountains underwent a remarkable land abandonment in the past decades. These large perturbation-dependent landscapes then evolved into new meta-stable states to balance human pressures and natural components with a general pattern homogenisation and several consequences on landscape services. These areas need effective management strategies to conserve a wide functionality allowing, at the same time, the sustainable development of population. Lack of resources and achievable restoration goals often hamper these objectives to be reached.In this paper, a study of pattern change is proposed using five landscape metrics and a stability analysis of features derived from land cover maps in order to investigate their magnitude and rate of change in a mountain municipality of central Italy between two separate time periods (1954–1985 and 1985–1999). A Kappa statistic (Kappa Index of Agreement), a Markov chain model and a Kruskal–Wallis test were employed. The results showed that shape and size of woodlands, open areas and buildings patches were significantly changed during the second period (1985–1999), with a concurrent abrupt reduction in the rate of change for each land cover, confirming that a new meta-stable state of equilibrium between human land use and natural processes of secondary succession was being approached.A discussion of management strategies for such equilibrium is therefore proposed to contribute to the development of effective conservation actions for the semi-natural landscapes of Mediterranean Basin. The presented approach aims to stimulate the inclusion of stability analysis into the planning and management of abandoned landscapes.
|
| [21] |
Comparing the input, output, and validation maps for several models of land change [J].https://doi.org/10.1007/s00168-007-0138-2 Magsci [本文引用: 1] 摘要
<a name="Abs1"></a>This paper applies methods of multiple resolution map comparison to quantify characteristics for 13 applications of 9 different popular peer-reviewed land change models. Each modeling application simulates change of land categories in raster maps from an initial time to a subsequent time. For each modeling application, the statistical methods compare: (1) a reference map of the initial time, (2) a reference map of the subsequent time, and (3) a prediction map of the subsequent time. The three possible two-map comparisons for each application characterize: (1) the dynamics of the landscape, (2) the behavior of the model, and (3) the accuracy of the prediction. The three-map comparison for each application specifies the amount of the prediction’s accuracy that is attributable to land persistence versus land change. Results show that the amount of error is larger than the amount of correctly predicted change for 12 of the 13 applications at the resolution of the raw data. The applications are summarized and compared using two statistics: the null resolution and the figure of merit. According to the figure of merit, the more accurate applications are the ones where the amount of observed net change in the reference maps is larger. This paper facilitates communication among land change modelers, because it illustrates the range of results for a variety of models using scientifically rigorous, generally applicable, and intellectually accessible statistical techniques.
|
| [22] |
Design and interpretation of intensity analysis illustrated by land change in Central Kalimantan, Indonesia [J].https://doi.org/10.3390/land2030351 URL [本文引用: 1] 摘要
Intensity Analysis has become popular as a top-down hierarchical accounting framework to analyze differences among categories, such as changes in land categories over time. Some aspects of interpretation are straightforward, while other aspects require deeper thought. This article explains how to interpret Intensity Analysis with respect to four concepts. First, we illustrate how to analyze whether error could account for non-uniform changes. Second, we explore two types of the large dormant category phenomenon. Third, we show how results can be sensitive to the selection of the domain. Fourth, we explain how Intensity Analysis’ symmetric top-down hierarchy influences interpretation with respect to temporal processes, for which changes during a time interval influence the sizes of the categories at the final time, but not at the initial time. We illustrate these concepts by applying Intensity Analysis to changes during one time interval (2000–2004) in a part of Central Kalimantan for the land categories Forest, Bare and Grass.
|
| [23] |
Detecting important categorical land changes while accounting for persistence [J].https://doi.org/10.1016/j.agee.2003.09.008 URL [本文引用: 1] 摘要
The cross-tabulation matrix is a fundamental starting point in the analysis of land change, but many scientists fail to analyze the matrix according to its various components and thus fail to gain as much insight as possible concerning the potential processes that determine a pattern of land change. This paper examines the cross-tabulation matrix to assess the total change of land categories according to two pairs of components: net change and swap, as well as gross gains and gross losses. Analysis of these components can distinguish between a clearly systematic landscape transition and a seemingly random landscape transition. Multiple resolution analysis provides additional information concerning the distances over which land change occurs. An example of change among four land categories in central Massachusetts illustrates the methods. These methods enable scientists to focus on the strongest signals of systematic landscape transitions, which is necessary ultimately to link pattern to process.
|
| [24] |
Landscape transformations in savannas of northern South America: land use/cover changes since 1987 in the Llanos Orientales of Colombia [J].https://doi.org/10.1016/j.apgeog.2011.08.010 URL [本文引用: 2] 摘要
This study presents a detailed spatial, quantitative assessment of the land use/cover changes (LUCC) in the savanna region of Llanos Orientales in Colombia. LUCC was determined from multitemporal satellite imagery (Landsat and CBERS) from 1987 to 2007. Systematic landscape transitions were identified and put in the context of population change and economic activity. The results showed that during the period 1987 to 2007, 14% of the study area underwent some kind of land use/cover change, with most change occurring in the last decade. Systematic transitions were observed from flooded savannas to crops and exotic pastures. An important land cover change was linked to the expansion of palm oil plantations from 31km 2 in 1987 to 162km 2 in 2007. The observed changes are shown to be related to the economic and market-oriented-development from before 1970 to the present day. Based on the future economic development plans, the Llanos Orientales will continue to undergo significant change as an estimated 70% of the 17,000km 2 have been identified for conversion to plantation, or for petroleum and mining purposes. We provide recommendations for future economy integrated conservation, by proposing the implementation of a Llanos ecological network.
|
| [25] |
The impact of global land-cover change on the terrestrial water cycle [J].https://doi.org/10.1038/nclimate1690 URL [本文引用: 1] 摘要
Floods and droughts cause perhaps the most human suffering of all climate-related events; a major goal is to understand how humans alter the incidence and severity of these events by changing the terrestrial water cycle. Here we use over 1,500 estimates of annual evapotranspiration and a database of global land-cover change to project alterations of global scale terrestrial evapotranspiration (TET) from current anthropogenic land-cover change. Geographic modelling reveals that land-cover change reduces annual TET by approximately 3,500kmyr(5%) and that the largest changes in evapotranspiration are associated with wetlands and reservoirs. Land surface model simulations support these evapotranspiration changes, and project increased runoff (7.6%) as a result of land-cover changes. Next we create a synthesis of the major anthropogenic impacts on annual runoff and find that the net result is an increase in annual runoff, although this is uncertain. The results demonstrate that land-cover change alters annual global runoff to a similar or greater extent than other major drivers, affirming the important role of land-cover change in the Earth System. Last, we identify which major anthropogenic drivers to runoff change have a mean global change statistic that masks large regional increases and decreases: land-cover change, changes in meteorological forcing, and direct COeffects on plants.
|
| [26] |
Derivation of a yearly transition probability matrix for land-use dynamics and its applications [J].https://doi.org/10.1007/s10980-009-9433-x Magsci [本文引用: 1] 摘要
Transition matrices have often been used in landscape ecology and GIS studies of land-use to quantitatively estimate the rate of change. When transition matrices for different observation periods are compared, the observation intervals often differ because satellite images or photographs of the research site taken at constant time intervals may not be available. If the observation intervals differ, the transition probabilities cannot be compared without calculating a transition matrix with the normalized observation interval. For such calculation, several previous studies have utilized a linear algebra formula of the power root of matrices. However, three difficulties may arise when applying this formula to a practical dataset from photographs of a research site. We examined the first difficulty, namely that plural solutions could exist for a yearly transition matrix, which implies that there could be multiple scenarios for the same transition in land-use change. Using data for the Abukuma Mountains in Japan and the Selva el Ocote Biosphere Reserve in Mexico, we then looked at the second difficulty, in which we may obtain no positive Markovian matrix and only a matrix partially consisting of negative numbers. We propose a way to calibrate a matrix with some negative transition elements and to estimate the prediction error. Finally, we discuss the third difficulty that arises when a new land-use category appears at the end of the observation period and how to solve it. We developed a computer program to calculate and calibrate the yearly matrices and to estimate the prediction error.
|
| [27] |
Land classification and change intensity analysis in a coastal watershed of southeast China [J].URL PMID: 3284993419950919592922232222249883808 |

/
| 〈 |
|
〉 |