尹卫霞 , 余瀚
, 余瀚
YIN Weixia, YU Han
通讯作者:
收稿日期: 2015-07-10
接受日期: 2016-01-10
网络出版日期: 2016-02-10
版权声明: 2016 地理科学进展 《地理科学进展》杂志 版权所有
基金资助:
作者简介:
作者简介:尹卫霞(1989-),女,山西忻州人,博士生,从事自然灾害人口脆弱性及风险评价研究,E-mail:yinwx@mail.bnu.edu.cn。
展开
摘要
在气候变化与城市化背景下,暴雨洪水灾害损失风险加剧,给人口生命安全带来极大威胁,评估暴雨洪水灾害的人口损失成为灾害风险研究关注的焦点问题。本文基于灾害系统理论,归纳了基于“致灾因子(H)—承灾体(V)—孕灾环境(E)—人口损失(D)”的暴雨洪水灾害人口损失评估的概念框架;基于现有国内外典型研究,梳理了相应的指标体系和研究方法,以“影响指标—损失指标—分析方法”多维图显示,认为“综合影响因素—人口损失”关系分析是评估暴雨洪水灾害人口损失的核心。目前人口损失的评估方法依据其考虑的要素可划分为:基于“H-D”关系的脆弱性曲线法、基于“H-V-E-D”关系的多要素综合法和刻画过程的灾害系统模拟法等。着重从数据可获取性和方法有效性两方面进行综述,认为单一方法不能满足人口损失风险评估的需求,因此从灾害系统角度出发,从单一要素向多要素综合发展、从指标统计分析向过程动态模拟发展、从单一方法向综合集成方法发展是人口损失及风险定量评估的发展趋势。
关键词:
Abstract
Under the background of global climate change and urbanization, the risk of heavy rain and floods increases rapidly, which poses great threats on the safety of the global population. It has become a focus in the field of natural disaster risk research to estimate the loss of life induced by heavy rain and floods. Based on the natural disaster system theory, this article first introduces a conceptual framework for estimating the loss of life induced by heavy rain and floods , which includes hazard (H)—exposure units (V)—disaster formative environment (E)—life losses (D). This framework indicates that life loss is a result of the interaction between these multiple elements. Based on existing research in China and internationally, the corresponding indicators and methods are summarized, which are presented in a multidimensional diagram of “impact indicator—loss indicator—analytical method.” This review article considers that the analysis of the multiple impacting factors-life losses relationship is at the core of the estimation of life loss from heavy rain and floods. Three types of methods for estimating the loss of life induced by heavy rain and floods are reviewed, including the vulnerability curve method that focuses on the relationship of H-D,integrated multi-factor analysis method that analyzes the relationship of H-V-E-D, and disaster system simulation method that considers the process of system evolution. Considering the availability of data and effectiveness of methods, no single method can meet the needs of risk assessment of life losses. From the perspective of natural disaster system, quantitative assessment of life loss and risk induced by heavy rain and floods should develop from including single factor to multiple factors; from using statistical analysis of indicators to dynamic simulation of processes; and from employing single method to the integration of multiple methods.
Keywords:
当前,气候变化所引起的灾害风险增加已成为影响全球安全与发展的重大挑战(UNISDR, 2009)。其中,暴雨洪水灾害是全球发生最频繁、影响最严重的自然灾害之一。仅在2000-2012年,全球发生特大规模洪水灾害2200次,平均每年影响人口数量达1亿左右(EM-DATA, 2014)。联合国政府间气候变化专门委员会的第五次评估报告预计,今后强降水等极端气候事件的出现将更加频繁(IPCC, 2013)。在全球变化背景下,未来暴雨洪水灾害风险将进一步增大。
灾害的人口损失历来是社会和公众关注的焦点,特别是由暴雨洪水造成的人口损失。人类“依水而居”的特性使其成为暴雨洪水灾害最敏感、最脆弱的承灾体,洪水灾害影响人口占所有自然灾害影响总人口的52%(Jonkman, 2005)。随着城市化进程加快,人口密度不断增加、人口和财富高度集中,使得人口受暴雨洪水灾害影响与日俱增、风险加剧(Hanson et al, 2011; Peduzzi et al, 2012)。有研究指出,过去40年世界人口增长了87%,而洪水易发区中的人口增长了114%(Velasquez et al, 2012)。暴雨洪水灾害人口损失评估已成为综合风险评估与防范研究亟待解决的重要议题。
暴雨洪水灾害对人口损失的影响机制复杂,它受区域经济、社会、文化等多因素综合影响,人口的主观能动性也使得灾害应对过程呈现高度的动态性和不确定性。如何定量评估暴雨洪水灾害人口损失是本文探讨的核心问题。本文基于灾害系统理论,梳理暴雨洪水灾害人口损失评估方法体系;重点对基于多要素综合、基于脆弱性曲线构建和基于灾害系统模拟的人口损失评估法进行综述,以期为暴雨洪水灾害人口损失及风险定量评估提供科学方法支撑。
在评估暴雨洪水灾害人口损失时,对于指标的分类,研究者们尚未达成一致的观点。Brazdova等(2014)将影响人口损失的指标分为致灾因子指标、暴露性指标、脆弱性指标三类;Penning-Rowsell等(2005)分为洪水强度指标、人口脆弱性指标、区域脆弱性指标;Jonkman(2007)则分为洪水指标和系统指标两类,系统指标具体包括建筑质量、撤离计划、人口响应行为等。不同的研究,虽然在指标的分类体系方面有较大差异,但在具体指标的选择方面有较高一致性。本文尝试从灾害系统的角度对这些指标进行分类。
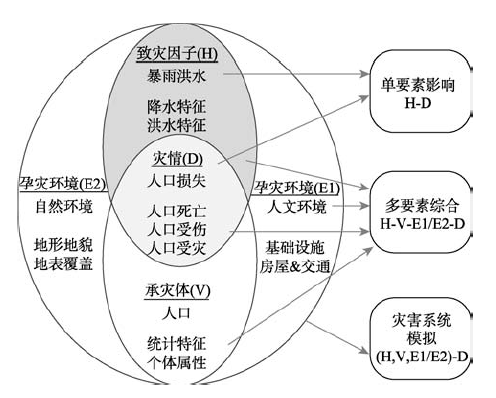
基于灾害系统理论,人口损失(D)是致灾因子危险性(H)、承灾体脆弱性(V)、孕灾环境不稳定性(E)综合作用的结果。其中,脆弱性指的是暴露承灾体的脆弱性(史培军, 1991, 2005)。图1是基于灾害系统的暴雨洪水灾害人口损失评估概念框架。暴雨洪水灾害系统的致灾因子通常涉及暴雨特征和洪水特征;孕灾环境包括地形、地表覆盖等自然环境和基础设施、房屋、交通等人文环境,它会对暴雨洪水强度产生放大或缩小作用,同时也会对人口承灾体的脆弱性产生影响。需特别指出的是,虽然暴雨洪水灾害的承灾体包括人口、房屋、交通、基础设施、自然资源等,但本文仅研究人口灾情,故人口为承灾体,交通、房屋、基础设施等视为人口损失的人文孕灾环境。人口灾情是指人口损失,包括人口死亡、人口受伤、人口受灾等。评估“综合影响因素—人口损失”的关系是暴雨洪水灾害人口损失评估的关键,其定量评估由简单到复杂可分为:“致灾因子(H)—人口损失(D)”评估、“致灾因子(H)—承灾体(V)—孕灾环境(E)—人口损失(D)”评估、灾害系统模拟评估3方面。
图1 基于灾害系统的暴雨洪水灾害人口损失评估概念框架
Fig.1 Framework for estimating the loss of life induced by heavy rain and floods based on the natural disaster system theory
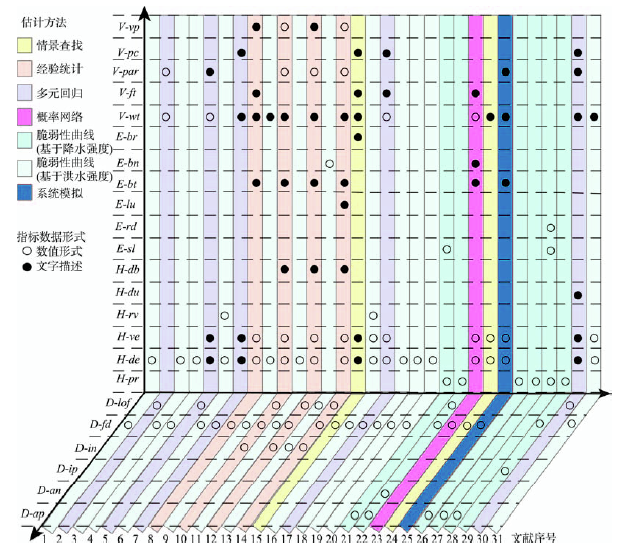
在大量文献阅读的基础上,本文选择31篇代表性文献,构建了“影响指标—损失指标—分析方法”多维图(图2)。其中包括6个致灾因子指标、6个孕灾环境指标、5个承灾体指标和6个人口损失指标(表1),这些指标的数据形式包括数值和文字。“影响指标—人口损失”关系评估方法包括情景查找、经验统计、多元回归、概率网络、脆弱性曲线以及灾害系统模拟等。
图2 暴雨洪水灾害人口损失评估的“影响指标—损失指标—分析方法”多维图①①对应文献为:1. 引自Jonkman, 2008; 2. Brown et al, 1988; 3. Duiser, 1989; 4. Waarts, 1992; 5. DeKay et al, 1993; 6. Vrouwenvelder et al, 1997; 7. Graham, 1999; 8. Reiter, 2001; 9. Jonkman, 2001; 10. Ramsbottom et al, 2003; 11. 引自 Jonkman, 2007; 12. Penning-Rowsell et al, 2005; 13. Zhai et al, 2006; 14. Priest et al, 2007; 15. 周克发等, 2007; 16. Jonkman et al, 2008; 17. 王志军等, 2008; 18. Jonkman et al, 2009; 19. Koshimura et al, 2009; 20. Boyd et al, 2010; 21. 史培军, 2011; 22. Li et al, 2012; 23. Peng et al, 2012; 24. Escuder-Bueno et al, 2012; 25. Johnston, 2012; 26. 黄崇福等, 2013; 27. Pang, 2013; 28. 杨帅等, 2014; 29. 扈海波等, 2014; 30. Brazdova et al, 2014; 31. U.S. Department of the Interior, 2014.
Fig.2 "Impact indicator—loss indicator—analytical method" multidimensional diagram based on references for estimating loss of life in flood disasters
表1 暴雨洪水灾害人口损失评估的指标代码解释
Tab.1 Codes of indicators used in estimating loss of life from heavy rain and floods
| 指标代码 | 指标名称及含义 | 指标代码 | 指标名称及含义 |
|---|---|---|---|
| V-vp | 脆弱性人口(如老年人、儿童、残疾/长期生病的人)占总人口的比例 | H-du | 洪水的持续时间 |
| V-pc | 洪水感知,如人口对洪水严重程度的理解 | H-rv | 洪水水面的上升速度 |
| V-par | 风险区人口数量 | H-ve | 洪水的流速 |
| V-ft | 洪水发生时间,包括假日凌晨、工作日凌晨、假日夜间、工作日夜间、白天 | H-de | 洪水影响区的水深 |
| V-wt | 预警时间,从预警发布到洪水到达前的时间 | H-pr | 降水量,如日降水量、3日降水量 |
| E-br | 建筑物抗洪能力 | D-lof | 人口死亡数量 |
| E-bn | 受淹房屋数量 | D-fd | 人口死亡率 |
| E-bt | 房屋类型,如可移动房屋、平房、一层以上楼房等 | D-in | 人口受伤数量 |
| E-lu | 土地利用类型,包括城市用地、农村用地、商业用地等 | D-ip | 人口受伤率 |
| E-rd | 到最近河流的距离 | D-an | 人口受灾数量 |
| E-sl | 地形条件,如坡度、坡降 | D-ap | 人口受灾率 |
| H-db | 洪水是否诱发泥石流次生灾害 |
由图2可以看出:①致灾因子指标以水深为主(73%的文献使用),其次为流速,它们是影响人口在洪水中稳定性的最重要因素,是表征洪水严重程度的关键指标(Reiter, 2001; Jonkman, 2007; Escuder-Bueno et al, 2012)。②孕灾环境指标多样。其中,人文孕灾环境(如房屋、交通等)的不稳定都会导致人口损失(Jonkman, 2007),形成“洪水→房屋倒塌/交通工具摧毁→人口砸伤/人口被困”灾害链。特定孕灾环境下的灾害链对灾情的放大作用在人口损失准确评估中需予以高度关注。③承灾体指标强调人口的动态性和主观能动性,如预警时间指标使用最多,占40%,通过人口的撤离、避难等行为影响人口损失(Graham, 1999; Boyd, 2010);又如,洪水发生时间,晚上或凌晨人口的状态会降低人口接受预警的可能性及应急响应能力,增加人口脆弱性,从而放大灾情。④灾情指标较为统一,以人口死亡率为主,占73%;人口损失率能直接体现区域受影响的程度(石勇等, 2009)。
基于多要素综合的人口损失评估法是分析“H-V-E-D”之间的关系,研究方法主要有情景查找、经验统计、多元回归和概率网络等方法。
(1) 情景查找方法
基于专家经验及案例,构建H、V、E的等级组合情景与人口损失率的关系表格,通过查找并与该表格内对应情景匹配得到现有或未来事件的人口损失,该方法可称为情景查找法。
Graham(1999)基于美国1960-1998年40个溃坝洪水案例,选取洪水严重程度(FS)、预警时间(WT)、人口对洪水严重性的理解程度(PC)3项指标,分别分等级依次设置情景(表2)。
表2 美国溃坝洪水人口死亡率查找表(引自:
Tab.2 Fatality rates of dam failure in the United States under different scenarios (From:
| 洪水强度(FS) | 预警时间 (WT) /min | 人口对洪水严重程度理解(PC) | 人口死亡率(可能死亡人口占风险中人口的比例) | |
|---|---|---|---|---|
| 估计值 | 估计范围 | |||
| 高 | - | - | 0.7600 | 0.300~1.0000 |
| 中 | 没有或几乎没有预警时间 | - | 0.1500 | 0.030~0.3500 |
| 少量预警时间 | 模糊理解 | 0.0400 | 0.010~0.0800 | |
| 准确理解 | 0.0200 | 0.005~0.0400 | ||
| 足够预警时间 | 模糊理解 | 0.0300 | 0.005~0.0600 | |
| 准确理解 | 0.0100 | 0.002~0.0200 | ||
| 低 | 没有或几乎没有预警时间 | - | 0.0100 | 0.000~0.0200 |
| 少量预警时间 | 模糊理解 | 0.0070 | 0.000~0.0150 | |
| 准确理解 | 0.0020 | 0.000~0.0040 | ||
| 足够预警时间 | 模糊理解 | 0.0003 | 0.000~0.0006 | |
| 准确理解 | 0.0002 | 0.000~0.0004 | ||
首先,基于FS的低、中、高等级,形成3个FS情景;然后,针对FS的中、低2个情景,再根据WT分为:没有或几乎没有预警时间(<15 min)、少量预警时间(15~60 min)和足够预警时间(>60 min)等级,形成6个“FS-WT”情景;最后,只针对WT≥15 min 的4个“FS-WT”情景,每个情景都分为模糊理解和准确理解,形成8个“FS-WT-PC”情景。最终形成1个FS、2个“FS-WT”、8个“FS-WT-PC”,共11个情景。为了建立各情景下的人口死亡率的估计值和阈值,将40个洪水灾害案例归类为上述的11个情景。针对每个情景下的案例死亡率,计算平均值作为“人口死亡率估计值”,识别最小值与最大值的阈值作为“人口死亡率估计范围”。此方法在国内也有应用(周克发等, 2007)。
情景查找方法不仅可以考虑H、V、E多要素对人口损失率的综合影响,而且为损失率估计提供了简单、快捷的查找途径,但情景的设定依赖于专家经验与先验知识,主观性较大,且案例数据的不完备性会使估计的人口损失率有一定的不确定性。该方法适用于暴雨洪水灾害人口损失的快速评估。
(2) 经验统计方法
以经验为基础构建H、V、E与D的关系式,以区域统计数据为基础计算人口损失的方法可归类为经验统计法。
英国水力研究院针对欧洲洪水开发的洪水人口风险法(Flood risks to people’ methodology)(Reiter, 2001; Ramsbottom et al, 2003; Penning-Rowsell et al, 2005),认为人口损失是洪水特征、位置特征、人口特征综合作用的结果,可用式(1)的概念模型表示:
式中:E为人口损失;F为洪水指标(水深、流速等),L为位置特征(在建筑内或外;房屋特征等);P为人口属性(年龄、健康等)。基于该概念模型,结合专家经验,提出人口受伤数量和死亡数量的计算方法:
式中, N(I)为受伤人口数量;N(Z)为风险区域人口数量;HR为洪水特征函数;AV为位置特征函数;PV为人口特征函数;N(D) 为死亡人口数量;N(I)为受伤人口数量;d为洪水水深(m);v为洪水流速(m/s);DF为洪水诱发泥石流的可能性赋分(由小到大,依此赋值0、0.5、1); ONSET为洪水上升速度赋值(1—非常缓慢/多个小时;2—缓慢/1小时左右;3—快速/小于1小时); AREA为区域特征赋值(1—多层建筑;2—两层建筑;3—平房、移动房、拥挤道路、停车场、露营地等); FW为洪水预警赋值(1—具有有效的洪水预警和应急计划;2—仅有有限的洪水预警系统;3—没有洪水预警系统); pi为区域内长期生病人口比例; pa为区域内75岁及以上人口比例
经验统计方法不仅以确定的公式表达H、V、 E等多要素与D的关系,且基础数据较易获取。但“H-V-E-D”关系式的构建是基于专家经验,在不同区域的适用性和推广性尚需进一步验证。该方法适用于案例数据缺少、调查数据较易获取区域的暴雨洪水灾害人口损失评估。
(3) 多元回归方法
基于洪水灾害案例和社会经济等数据,拟合D与H、V、E之间关系函数的方法可归类为多元回归法。
全球尺度上,UNDP(Peduzzi et al, 2009)在对人口死亡风险进行评价时,构建了洪水死亡人口数量与洪水频次、暴露人口数量及多脆弱性指标的多元回归模型(式(7)):
式中:K为洪水灾害导致的死亡人数;C为常数;PhExp为物理暴露,即生活在暴露区的人口数量乘以致灾因子发生频率;Vi为社会经济参数,包括经济、环境、人口、健康、卫生条件、预警能力、教育、发展8个方面的25个变量; ai为Vi的指数。基于各国1980-2000年的相关数据对式(7)的参数进行拟合,得到全球尺度洪水灾害人口损失估计函数。
在大洲尺度上,有研究者针对中欧地区的洪水灾害,构建了式(8)的人口死亡数量多元回归模型(Brazdova et al, 2014):
式中,LOL为人口死亡数量;D为物质损失($),间接表征洪水危险性;P为洪水管理因素,包括对洪水危险性的认知、洪水经验、洪水管理相关文件、对水文预报的反应、对洪水预警的反应、撤离/应急行动等8个指标,各指标分别赋值后求平均得P值;W为洪水预警因素,包括水文预报条件、洪水到达速度、预警条件、洪水上升速度等4个指标,各指标分别赋值后求平均得W值;a、b、c、d是系数。各参数的拟合是基于19个中欧洪水案例数据得到,分别为:
在国家尺度上,有学者根据中国溃坝案例数据,基于支持向量机方法,构建了人口损失率同溃坝洪水严重程度、救援能力、警报时间、溃坝发生时间以及风险人口对溃坝洪水严重性的理解程度5个变量的回归模型(王志军等, 2008)。
多元回归分析方法以连续函数形式表达H、V、E等多要素与D的关系,且模型的参数可直接、客观地反映不同要素对人口损失形成的贡献。该方法适用于暴雨洪水灾害人口损失的驱动因素分析。
(4) 概率网络方法
通过构建指标的网络关系,基于概率估计,推算人口死亡率的方法,可归为概率网络法。应用概率网络法的一般模式是以节点代表随机变量,节点之间的有向边代表节点间的互相关系(由父节点指向其子节点),用条件概率表达关系强度,没有父节点的用先验概率进行信息表达。
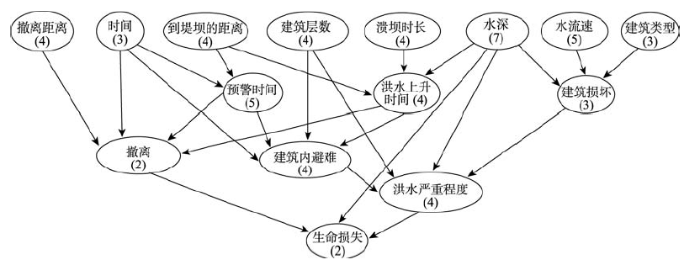
Peng等(2012)提出了基于贝叶斯网络评估人口损失的方法,其选取15个影响指标作为基本节点(8个)和中间节点(6个),生命损失指标作为端节点(1个),给出了16个节点所有可能的状态以及各节点之间的关系(图3)。图中数字表示节点的状态类别的个数:“撤离距离”有4个状态,分别为0~100 m、100~500 m、500~2000 m、>2000 m;“时间”有3个状态,分别为8:00-17:00、17:00-22:00、22:00-8:00;“到堤坝的距离”有4个状态,分别为0~4.8 km、4.8~12 km、12~36 km、>36 km;“建筑层数”有4个状态,分别为1层、2层、3层、3层以上;“溃坝时长”有4个状态,分别为0~1 h、1~3 h、3~9 h、>9 h;“水深”有7个状态,分别为0~1.5 m、1.5~3 m、3 m~4.5 m、4.5~6 m、6~7.5 m、7.5~9 m、>9 m;“水流速”有5个状态,分别为0~1 m/s、1~2 m/s、2~4 m/s、4~6 m/s、>6 m/s;“建筑类型”有3个状态,分别为非固定木制结构、固定木制结构、砌体/混凝土/砖造结构;“预警时间”有5个状态,分别为0~0.25 h、0.25~1 h、1~3 h、3~6 h、>6 h;“洪水上升时间”有4个状态,分别为0~0.25 h、0.25~1 h、1~3 h、>3 h;“建筑损坏”有3个状态,分别为轻微损坏、部分损坏、大部分损坏;“撤离”有2个状态,分别为撤离、没有撤离;“建筑内避难”有4个状态,分别为没有建筑可避难、最高第二层可躲避、最高第三层可躲避、第三层以上可躲避;“洪水严重程度”有4个状态,分别为安全、低严重、中严重、严重;生命损失有2个状态,分别为存活、死亡。
图3 评估人口损失的贝叶斯网络(修改自:
Fig.3 Bayesian network for estimating loss of life (Modified from:
首先,基于案例数据、专家经验推算得到各基本节点的不同状态的先验概率,如“时间”状态为“8:00-17:00”的先验概率,等于发生在8:00-17:00之间的洪水案例数量占总案例数量的比例(0.38)。然后,结合现有文献中的理论模型、物理模型及专家经验等定量各指标的不同状态间的条件概率,例如,基于Graham(1999)给出的预警启动时间和基于对洪水流速的估计,利用蒙特卡洛模拟,得到预警时间各状态的条件概率;当“到堤坝的距离”的状态为“0~4.8 km”、“时间”的状态为“8:00-17:00”时,“预警时间”状态为“0~0.25 h”、“0.25~1 h”、“1~3 h”“3~6 h”“>6 h”的条件概率分别为0.0772、0.5009、0.4219、0 和0。最后,基于以上计算得到的先验概率和条件概率,推算得到各中间节点、端节点不同状态的先验概率,端节点处于“死亡”状态的先验概率即为人口死亡率。
概率网络方法定量表达了H、V、E、D之间复杂的关系,可以揭示各影响因素对人口损失的作用机制。但这种指标间的相互影响关系只是逻辑上的关联,仅是对可能性的表达。该方法适用于区域暴雨洪水灾害人口损失风险评价。
表达H与D之间的函数关系的曲线,称为脆弱性曲线,是定量评估人口损失和风险的主要方法之一。
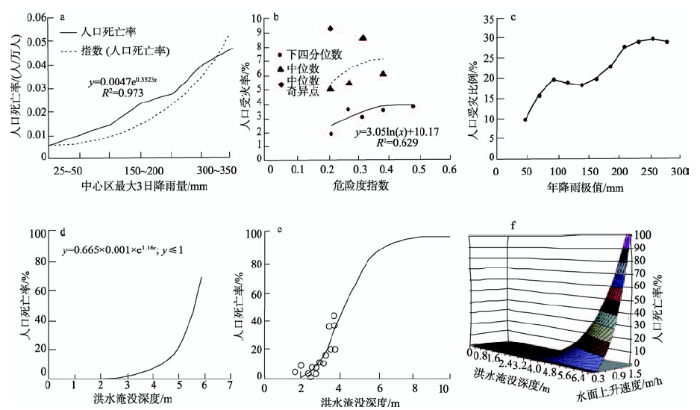
暴雨洪水灾害人口脆弱性曲线的函数拟合形式包括指数(图4a、4d)、对数(图4b)、“S”型(图4e)、三维曲面(图4f)等。当灾害案例样本较少时(Pang, 2013; 黄崇福等, 2013),也可能使用折线形式表达(图4c)。
图4 暴雨洪水灾害人口脆弱性曲线
Fig.4 Examples of population vulnerability curve based on heavy rain and flood intensities
依据致灾因子指标类型,将暴雨洪水灾害人口脆弱性曲线分为两类:一是基于降雨强度的脆弱性曲线(图4a-4c) (Li et al, 2012; 黄崇福等, 2013; 杨帅等, 2014),二是基于洪水强度的脆弱性曲线(图4d-4f) (Jonkman et al, 2002, 2007)。
基于降水强度的人口脆弱性曲线研究中,大多采用降水量指标,如日最大降水量(李晓萌等, 2013)、3日最大降水量(Li et al, 2012; 邢颖, 2014)等指标。Li等(2012)在分析人口损失数量与洪水影响中心区1-7日最大降水量的相关性的基础上,提出3日最大降水量对洪水损失的影响最大;进而选取3日最大降水量作为测量洪水强度的指标,构建人口脆弱性曲线。也有学者使用地形(史培军, 2011; 杨帅等, 2014)、地表覆盖(杨帅等, 2014)等因素对降水量进行修正,以区分相同降水量情况下,不同区域因地形条件、河网特征等孕灾环境不同而形成的洪水强度差异。由于降水量指标可直接应用气象观测数据,因此在数据的可获取性等方面具有明显优势(Wheater et al, 2005)。
基于洪水强度的人口脆弱性曲线研究中,大多采用水深、流速和水面上升速度等指标。水深是影响静态洪水人口损失的重要因素,常作为曲线函数关系式的自变量。流速和水面上升速度是表征动态洪水危险性的重要参数(Middelmann-Fernandes, 2010),但因数据获取有一定难度,仅作为分区构建脆弱性曲线的依据(Papathoma-Köhle et al, 2011)。如Jonkman(2007)认为对于同一场洪水灾害,不同区域洪水强度差异大,对应的“H—D”关系也有所差异,因此基于洪水流速、水面上升速度划分出不同的灾害区,分别构建“水深—人口死亡率”曲线,如式(9)-(11)。
防洪堤断裂区:
洪水快速上升区:
其他受影响区:
式中,
Vrouwenvelder(1997)构建了人口死亡率FD与淹没水深h(m)、水面上升速度v(m/h)的关系,用三维空间曲面来表达“D—H”关系(图4f),该方法综合考虑了两个致灾因子指标对人口损失的影响,为分析多要素与人口损失的定量关系提供了重要思路。
洪水强度可通过文献记录整合方法,获取粗略的淹没范围或水深数据(Jonkman, 2007);也可通过洪水淹没模拟,获取淹没范围、水深、流速等数据。如Jonkman(2007)通过SOBEK-1D2D模型,模拟了新奥尔良地区一场洪水灾害的水深、流速、水深×流速、上升速度、洪水到达时间等指标(250 m网格),并结合人口死亡率分布数据,分析了这些指标同人口死亡率的关系。洪水淹没模拟法是弥补观测数据不足的重要途径。
灾害系统模拟是指设计一个实际或理论的物理系统模型,运用计算机模拟技术来分析灾害的动态演化过程。该方法是分析暴雨洪水灾害演化过程中H、V、E之间的动态关系的重要途径。
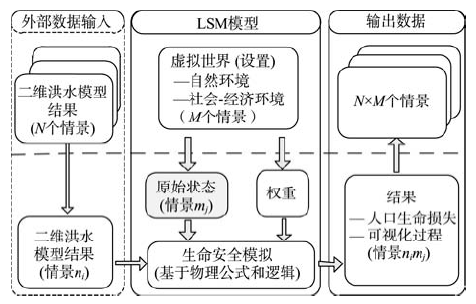
人口的移动性、主观能动性、智能性等特征,使其成为区域灾害系统中较为特殊的一类承灾体。上述损失评估方法不能完全表达人口承灾体的这些特征,而当前较为热点的解决方法是引入智能体建模的方法体系。多智能体建模作为一种复杂系统模拟和仿真方法,侧重于从组成系统的微观主体出发,通过对不同类型主体的判断、学习、控制、反应等个性机制的设计,使系统中所有主体产生互动,从而表现出系统的宏观复杂性。相比各种传统的从整体上把握系统宏观特性的方法,这种自上而下的建模方式能更直观、现实地表达系统的复杂性,因而被广泛用于多种复杂系统的仿真模拟(王飞等, 2009)。人口在面对暴雨洪水时,作为具有独立智能的个体,其行为活动是最适合用智能体来进行描述与刻画的。已有相关研究试图用多智能体来模拟暴雨洪水灾害系统内,人口作为承灾体与致灾因子、孕灾环境之间的相互作用(令狐彬, 2014)。目前,洪水人口灾害系统模拟模型有HAZUS模型(Federal Emergency Management Agency, 2015)、生命模拟模型(LIFESim)(Aboelata et al, 2008)、生命安全模型(The Life Safety Model, LSM)(Johnston, 2012)等。其中,LSM就是一个基于多智能体方法的微观模型。
LSM通过模拟承灾体(包括人口、建筑、车辆等)之间及其与洪水的动态作用来评估人口损失数量。图5是该模型的组成及概念框架:首先,以二维洪水模型的模拟结果为输入数据(H的情景);然后,对自然环境、社会—经济环境等条件(V/E情景)进行设置,并结合输入数据,形成各种可能的“H-V/E”情景;最后,利用生命安全模拟器模拟各种情景下的洪水灾害动态演化过程。模拟过程中,承灾体之间及其与洪水的相互作用是基于基础物理学模型和逻辑来判断。模型最终输出各种情景下洪水灾害的可视化过程及人口损失数量。
图5 LSM模型组成及概念框架(修改自:
Fig.5 Conceptual framework and components of the Life Safety Model (LSM) (Modified from:
基于案例数据构建暴雨洪水灾害“H-D”或“H-V-E-D”关系时,相关数据的缺乏导致关系构建中遇到许多困难,尤其是严重灾害情景数据,以及和人类活动、预警系统相关的数据。灾害系统模拟中不同的情景设置条件为尝试解决该问题提供了重要方法。
本文基于灾害系统理论,归纳了基于“H-V-E-D”的暴雨洪水灾害人口损失评估概念框架,并梳理了相应的指标体系。重点强调 “综合影响因素—人口损失”关系分析是评估暴雨洪水灾害人口损失的核心。人口损失评估方法主要涉及3类:分析“H-D”关系的脆弱性曲线法,分析“H-V-E-D”关系的多要素综合法和考虑整个系统演化过程的灾害系统模拟法。暴雨洪水灾害人口损失评估研究的进展及进一步发展方向有以下三方面。
(1) 从单一要素向多要素综合发展。暴雨洪水灾害损失受自然、社会、经济等多要素综合影响。受灾害形成机理的复杂性和数据的可获取性限制,前期研究多关注单一指标或单类指标。如脆弱性曲线构建多针对“水深”这一指标。随着对成灾机理认知的深入和影响因素测量的精细化,单指标已不能满足风险评估的需求,人口损失评估逐渐向多要素综合发展。目前研究不仅关注水深、流速、水面上升速度等多个致灾因子指标,且更加关注致灾强度、人口承灾体脆弱性、自然/人文孕灾环境特征等多类指标。暴雨洪水灾害是一个复杂的过程,灾害系统理论可为有效分析多因素与人口损失的关系提供理论支撑。目前研究中对致灾因子指标的探讨更多、更完善,深入考虑“致灾因子—孕灾环境—承灾体”多要素综合作用对人口损失的影响,是未来暴雨洪水灾害人口损失研究的重点和难点问题。
(2) 从指标统计分析向过程动态模拟发展。暴雨洪水灾害人口损失评估的研究中,多基于指标的统计数据评估人口损失。指标的统计分析反映的是人口属性和暴雨洪水致灾因子危险性的平均状态,未揭示灾害过程中人口承灾体和暴雨洪水的相互作用。随着对人口主观能动性的深入理解和高度关注,以及复杂系统模拟技术的发展,基于属性指标的统计方法已不能适应对人类活动复杂过程的刻画,面向风险的人口损失评估逐渐向过程动态模拟发展,不仅可有效反映人口个体的移动性、主观能动性、智能性等特征在灾情形成过程中发挥的重要作用,而且可以对未来不同情景下的人口损失进行预测。灾害系统模拟为暴雨洪水灾害过程的动态模拟提供了有效方法。同时,人员的转移安置过程也会大大降低人口损失。在中国“举国体制”背景下,转移安置的减灾效果尤为明显:2013年,中国全年因自然灾害紧急转移安置人口达1215万人次(中华人民共和国民政部, 2014)。量化转移安置动态过程对人口损失的影响,是未来暴雨洪水灾害人口损失评估需解决的关键问题。
(3) 从单一方法向综合集成方法发展。多要素、多过程及多尺度的综合集成研究是揭示区域人地相互作用机制、寻求全球可持续发展途径的基础(Future Earth, 2013)。暴雨洪水灾害人口损失的评估涉及:H、E、V等多类要素,暴雨诱发洪水、洪水淹没/冲毁承灾体、人口避灾等多个复杂过程,全球、大洲、国家、地方等多个尺度。现有的评估方法对要素、过程的刻画各有侧重:多要素综合方法对多类别、多数量的要素分析具有优势;脆弱性曲线是风险定量评价的重要方法;灾害系统模拟方法是剖析暴雨洪水灾害复杂过程的重要工具。不同方法适用于不同的时空尺度研究。基于对多要素、多过程、多尺度的综合考虑,发展综合集成方法,是暴雨洪水灾害人口损失风险评估发展的必然趋势。
The authors have declared that no competing interests exist.
| [1] |
暴雨灾害人员损失风险快速预评估模型 [J].https://doi.org/10.3969/j.issn.1000-811X.2014.01.006 URL 摘要
研究在暴雨灾害致灾因子强度分析、孕灾环境敏感性评估等基础上, 把人作为主要的承灾体,用人口密度来评估风险暴露因子;参照北京地区暴雨洪涝的历史灾情资料,建立致灾因子强度(等效日雨量)与人员损失之间的损失系数估 算方程;以不同时段外出人员的比率作为时间纠正系数;最后用因子乘积方式建立人员损失风险预评估模型.以“7·21”和“6·23”暴雨为个例,进行了模 型的应用及检验分析.“7·21”个例选用的雨量数据是BJ_ RUC(24h)预报雨量场,“6·23”选用较为贴近实况的BJ_ ANC定量降水估计QPE资料.检验发现模型估算的“7 ·21”暴雨人员损失总数在数量级别上与实况比较接近,而基于空间网格的人员损失风险预评结果与实际遇难人员发现地点在空间分布上基本一致.尽管 “6·23”暴雨的人员损失预评估的总数不足1人,但在局部地区的损失风险仍然较大,个别格点甚至达到0.40人的风险水平.而这次暴雨过程导致了比较严 重的城市内涝,实际上也发生了几例比较偶然的人员因灾死亡事故.实例应用表明损失预评估可反映出人员损失的基本情况及风险水平,可用于决策气象服务及预警 信息发布的主要依据.
Quick assessing model on casualty loss in Rainstorms [J].https://doi.org/10.3969/j.issn.1000-811X.2014.01.006 URL 摘要
研究在暴雨灾害致灾因子强度分析、孕灾环境敏感性评估等基础上, 把人作为主要的承灾体,用人口密度来评估风险暴露因子;参照北京地区暴雨洪涝的历史灾情资料,建立致灾因子强度(等效日雨量)与人员损失之间的损失系数估 算方程;以不同时段外出人员的比率作为时间纠正系数;最后用因子乘积方式建立人员损失风险预评估模型.以“7·21”和“6·23”暴雨为个例,进行了模 型的应用及检验分析.“7·21”个例选用的雨量数据是BJ_ RUC(24h)预报雨量场,“6·23”选用较为贴近实况的BJ_ ANC定量降水估计QPE资料.检验发现模型估算的“7 ·21”暴雨人员损失总数在数量级别上与实况比较接近,而基于空间网格的人员损失风险预评结果与实际遇难人员发现地点在空间分布上基本一致.尽管 “6·23”暴雨的人员损失预评估的总数不足1人,但在局部地区的损失风险仍然较大,个别格点甚至达到0.40人的风险水平.而这次暴雨过程导致了比较严 重的城市内涝,实际上也发生了几例比较偶然的人员因灾死亡事故.实例应用表明损失预评估可反映出人员损失的基本情况及风险水平,可用于决策气象服务及预警 信息发布的主要依据.
|
| [2] |
洪涝灾害风险分析的基本范式及其应用 [J].
目前,洪涝灾害风险分析的模型 名目繁多、参差不齐。提出了洪涝灾害风险分析的基本范式,涉及气象因子和社会因子。进而,将其发展为一个由年降雨量极值概率分布和"年降雨量极值-受灾人 口比例"脆弱性曲线组成的应用模型。模型中采用信息分配方法估计概率分布,采用正态信息扩散方法构造脆弱性曲线。将概率分布和脆弱性曲线相乘后进行积分, 即可算出研究区域内年度洪涝灾害的风险,其内涵是受灾人口比例的期望值。广东省河源市的案例分析表明,模型简单实用。由于物理背景清楚,风险内涵明确,加 之采用的信息扩散技术处理小样本能够提高不完备信息的利用率,从而使风险分析的结果较为可靠。
Basic paradigm of risk analysis in flood disaster and its application [J].
目前,洪涝灾害风险分析的模型 名目繁多、参差不齐。提出了洪涝灾害风险分析的基本范式,涉及气象因子和社会因子。进而,将其发展为一个由年降雨量极值概率分布和"年降雨量极值-受灾人 口比例"脆弱性曲线组成的应用模型。模型中采用信息分配方法估计概率分布,采用正态信息扩散方法构造脆弱性曲线。将概率分布和脆弱性曲线相乘后进行积分, 即可算出研究区域内年度洪涝灾害的风险,其内涵是受灾人口比例的期望值。广东省河源市的案例分析表明,模型简单实用。由于物理背景清楚,风险内涵明确,加 之采用的信息扩散技术处理小样本能够提高不完备信息的利用率,从而使风险分析的结果较为可靠。
|
| [3] |
基于格网的洪水灾害危险性评价分析: 以巴基斯坦为例 [J].https://doi.org/10.3724/SP.J.1047.2013.00314 [本文引用: 1] 摘要
洪水灾害已成为给当今人类带来严重损失的自然灾害之一, 因此, 灾害风险评价是区域经济持续发展的前提与条件。本文从致灾因子和孕灾环境两方面进行分析, 综合考虑降水(累计降雨量和最大降雨量)、河流(河网密度)、地形(高程值和坡度值)、土地利用和植被(NDVI)共5 种相关因子, 以1km格网数据为基础, 运用AHP(层次分析法)对巴基斯坦洪水灾害进行了危险性评价。结果表明:巴基斯坦洪水灾害危险性受降雨和地形的影响较大, 其危险程度东南部大于西北部, 并由东南部向西北部逐渐递减。
Flood hazard assessment in Pakistan at grid scale [J].https://doi.org/10.3724/SP.J.1047.2013.00314 [本文引用: 1] 摘要
洪水灾害已成为给当今人类带来严重损失的自然灾害之一, 因此, 灾害风险评价是区域经济持续发展的前提与条件。本文从致灾因子和孕灾环境两方面进行分析, 综合考虑降水(累计降雨量和最大降雨量)、河流(河网密度)、地形(高程值和坡度值)、土地利用和植被(NDVI)共5 种相关因子, 以1km格网数据为基础, 运用AHP(层次分析法)对巴基斯坦洪水灾害进行了危险性评价。结果表明:巴基斯坦洪水灾害危险性受降雨和地形的影响较大, 其危险程度东南部大于西北部, 并由东南部向西北部逐渐递减。
|
| [4] |
基于多agent的洪涝灾害风险仿真研究[D] .Simulation of flood disaster risk based on multi-agent[D]. |
| [5] |
灾害研究的理论与实践 [J].Zaihai yanjiu de lilun yu shijian [J]. |
| [6] |
四论灾害系统研究的理论与实践 [J].https://doi.org/10.3969/j.issn.1004-4574.2005.06.001 URL [本文引用: 1] 摘要
作者曾分别于 1991,1995和2001年发表了关于灾害研究理论与实践的3篇文章,对灾害系统的性质、动力学机制等进行了探讨。本文在前3篇文章的基础上,从综合 灾害风险管理的角度,完善了灾害系统的结构与功能体系,论证了灾情形成过程中恢复力的作用机制,分析了区域开发与安全建设的互馈关系,构建了区域综合减灾 的行政管理体系,提出了由政府、企业与社区构成的区域综合减灾范式。研究结果表明,区域灾情形成过程中,脆弱性与恢复力有着明显的区别,脆弱性是区域灾害 系统中致灾因子、承灾体和孕灾环境综合作用过程的状态量,它主要取决于区域的经济发达程度与社区安全建设水平;恢复力则是灾害发生后,区域恢复、重建及安 全建设与区域发展相互作用的动态量,它主要取决于区域综合灾害风险行政管理能力、政府与企业投入和社会援助水平。区域安全水平与土地利用的时空格局和产业 结构关系密切,通过划定区域高风险“红线区”的办法,调整土地利用时空格局和产业结构,有利于建立区域可持续发展的综合减灾范式。针对区域自然灾害系统存 在着相互作用、互为因果的灾害链规律,以及灾害系统所具有的结构与功能特征,完善由纵向、横向和政策协调共同组成的一个“三维矩阵式”的区域综合减灾行政 管理体系,构建以政府为主导、企业为主体、社区全面参与的区域综合减灾范式。以此促进在发展中提高区域减灾能力,并在一定安全水平下,建设区域可持续发展 模式。
Theory and practice on disaster system research in a fourth time [J].https://doi.org/10.3969/j.issn.1004-4574.2005.06.001 URL [本文引用: 1] 摘要
作者曾分别于 1991,1995和2001年发表了关于灾害研究理论与实践的3篇文章,对灾害系统的性质、动力学机制等进行了探讨。本文在前3篇文章的基础上,从综合 灾害风险管理的角度,完善了灾害系统的结构与功能体系,论证了灾情形成过程中恢复力的作用机制,分析了区域开发与安全建设的互馈关系,构建了区域综合减灾 的行政管理体系,提出了由政府、企业与社区构成的区域综合减灾范式。研究结果表明,区域灾情形成过程中,脆弱性与恢复力有着明显的区别,脆弱性是区域灾害 系统中致灾因子、承灾体和孕灾环境综合作用过程的状态量,它主要取决于区域的经济发达程度与社区安全建设水平;恢复力则是灾害发生后,区域恢复、重建及安 全建设与区域发展相互作用的动态量,它主要取决于区域综合灾害风险行政管理能力、政府与企业投入和社会援助水平。区域安全水平与土地利用的时空格局和产业 结构关系密切,通过划定区域高风险“红线区”的办法,调整土地利用时空格局和产业结构,有利于建立区域可持续发展的综合减灾范式。针对区域自然灾害系统存 在着相互作用、互为因果的灾害链规律,以及灾害系统所具有的结构与功能特征,完善由纵向、横向和政策协调共同组成的一个“三维矩阵式”的区域综合减灾行政 管理体系,构建以政府为主导、企业为主体、社区全面参与的区域综合减灾范式。以此促进在发展中提高区域减灾能力,并在一定安全水平下,建设区域可持续发展 模式。
|
| [7] |
|
| [8] |
洪水灾害脆弱性研究进展 [J].https://doi.org/10.11820/dlkxjz.2009.01.006 [本文引用: 1] 摘要
<p>洪水灾害是当今世界最严重的自然灾害之一,洪灾经济损失及风险评估是防洪减灾领域的一项基础性工 作,而脆弱性的确定是评估模型的关键。文章在对自然灾害脆弱性评估方法总结的基础上,着重对洪水情景模拟中 代表脆弱性的灾损率曲线开展探讨,对灾损曲线的起源、建立方法和综合运用的趋势进行研究。国外保险业与政府 开展此类工作较早,相比于国外已经取得的丰硕研究成果而言,国内灾损率研究远远不能为决策提供有效的指导, 这与我国面临的巨大洪灾风险不相称。政府、保险等部门与科研工作急需结合起来,填补城市洪灾脆弱性研究空 白,多参数综合调研、深入各种承灾体内部系统而细致地开展灾损率调查,对于减少未来洪灾影响,具有非常重要 的实际意义。</p>
A review on development of vulnerability assessment of floods [J].https://doi.org/10.11820/dlkxjz.2009.01.006 [本文引用: 1] 摘要
<p>洪水灾害是当今世界最严重的自然灾害之一,洪灾经济损失及风险评估是防洪减灾领域的一项基础性工 作,而脆弱性的确定是评估模型的关键。文章在对自然灾害脆弱性评估方法总结的基础上,着重对洪水情景模拟中 代表脆弱性的灾损率曲线开展探讨,对灾损曲线的起源、建立方法和综合运用的趋势进行研究。国外保险业与政府 开展此类工作较早,相比于国外已经取得的丰硕研究成果而言,国内灾损率研究远远不能为决策提供有效的指导, 这与我国面临的巨大洪灾风险不相称。政府、保险等部门与科研工作急需结合起来,填补城市洪灾脆弱性研究空 白,多参数综合调研、深入各种承灾体内部系统而细致地开展灾损率调查,对于减少未来洪灾影响,具有非常重要 的实际意义。</p>
|
| [9] |
基于多智能体的自然灾害动态风险评估模型 [J].
将多智能体建模方法引入灾害风险评估领域,以期为灾害风险评估开拓新的研究思路.区别于一般静态评估模型,基于多智能体的风险评估模型自下而上,从微观上 建立灾害系统各要素之间的相互关系,在多风险情景下,仿真模拟灾害系统状态的变化,以实现动态的风险评估.在理解多智能体建模的一般原理的基础上,设计了 基于多智能体的自然灾害动态风险评估的总体模型和主要智能体的结构,并总结了多智能建模在风险评估方面的优势.
Assessing model for dynamic risk of natural disasters based on multi-agent system [J].
将多智能体建模方法引入灾害风险评估领域,以期为灾害风险评估开拓新的研究思路.区别于一般静态评估模型,基于多智能体的风险评估模型自下而上,从微观上 建立灾害系统各要素之间的相互关系,在多风险情景下,仿真模拟灾害系统状态的变化,以实现动态的风险评估.在理解多智能体建模的一般原理的基础上,设计了 基于多智能体的自然灾害动态风险评估的总体模型和主要智能体的结构,并总结了多智能建模在风险评估方面的优势.
|
| [10] |
基于支持向量机的溃坝生命损失评估模型及应用 [J].https://doi.org/10.3969/j.issn.0559-9342.2008.01.021 URL [本文引用: 1] 摘要
针对溃坝生命损失历史资料缺乏且影响因素复杂的特点,鉴于支持向 量机算法的诸多优势,建立了基于支持向量机的溃坝生命损失评估模型.将溃坝生命损失定义为风险人口与生命损失率的乘积,分析了生命损失的评估指标,建立了 综合评估体系.根据我国已溃决大坝的历史资料,构建了学习样本.留一法交互校验结果表明,该评估方法具有一定的精度.
Model for evaluation of loss-of-life caused by dam breach based on support vector machine [J].https://doi.org/10.3969/j.issn.0559-9342.2008.01.021 URL [本文引用: 1] 摘要
针对溃坝生命损失历史资料缺乏且影响因素复杂的特点,鉴于支持向 量机算法的诸多优势,建立了基于支持向量机的溃坝生命损失评估模型.将溃坝生命损失定义为风险人口与生命损失率的乘积,分析了生命损失的评估指标,建立了 综合评估体系.根据我国已溃决大坝的历史资料,构建了学习样本.留一法交互校验结果表明,该评估方法具有一定的精度.
|
| [11] |
气候变化情景(B2)下中国洪水灾害风险的定量研究[D]. 北京: China under climate change scenarios (B2) quantitative study of flood disaster risk[D]. Beijing, China: |
| [12] |
县域暴雨洪涝灾害损失快速评估方法探讨: 以湖南省为例 [J].
灾害损失的快速评估是科学制定 应急救灾决策、合理分配救灾资源的重要前提,关系到整个救灾行为的效果。从暴雨洪涝灾害发生机制出发,借助多因子加权评价法、Arcgis空间分析等,通 过灾害危险度与灾损率的函数关系拟合,探讨了灾害损失快速评估的方法。结果表明:(1)洞庭湖周边县域成为暴雨洪涝灾害的高危险区,湘江、沅水干流沿岸附 近县域也面临较高风险,而湘西南、湘西、湘东南地区县域洪涝成灾压力较小;(2)所提损失快速评估方法对减少灾情快速评估中的主观判断,增加科学性起到一 定的作用。
Exploration of rapid evaluation method for rainstorm flood losses at county level: A case study of Hunan Province [J].
灾害损失的快速评估是科学制定 应急救灾决策、合理分配救灾资源的重要前提,关系到整个救灾行为的效果。从暴雨洪涝灾害发生机制出发,借助多因子加权评价法、Arcgis空间分析等,通 过灾害危险度与灾损率的函数关系拟合,探讨了灾害损失快速评估的方法。结果表明:(1)洞庭湖周边县域成为暴雨洪涝灾害的高危险区,湘江、沅水干流沿岸附 近县域也面临较高风险,而湘西南、湘西、湘东南地区县域洪涝成灾压力较小;(2)所提损失快速评估方法对减少灾情快速评估中的主观判断,增加科学性起到一 定的作用。
|
| [13] |
|
| [14] |
我国溃坝生命损失评价模型初步研究 [J].https://doi.org/10.3969/j.issn.1009-6094.2007.03.037 URL [本文引用: 1] 摘要
根据我国8座已溃决大坝的现场调查结果,结合国内外溃坝生命损失 研究成果,初步研究并提出适合我国实际情况的溃坝生命损失评价模型和风险人口死亡率,应用该模型和Graham法估算了这8座水库的溃坝生命损失,与实际 生命损失情况进行了比较.结果表明,模型具有一定的适用性.
Evaluation model of loss of life due to dam breach in China [J].https://doi.org/10.3969/j.issn.1009-6094.2007.03.037 URL [本文引用: 1] 摘要
根据我国8座已溃决大坝的现场调查结果,结合国内外溃坝生命损失 研究成果,初步研究并提出适合我国实际情况的溃坝生命损失评价模型和风险人口死亡率,应用该模型和Graham法估算了这8座水库的溃坝生命损失,与实际 生命损失情况进行了比较.结果表明,模型具有一定的适用性.
|
| [15] |
LIFESim: A tool for estimating and reducing life-loss resulting from dam and levee failures [C]// |
| [16] |
Estimating and mapping the direct flood fatality rate for flooding in Greater New Orleans due to Hurricane Katrina [J].https://doi.org/10.2202/1944-4079.1017 URL [本文引用: 1] 摘要
Abstract The unprecedented tragedy of Hurricane Katrina produced unprecedented data for studying the impacts of natural disasters. The current paper looks at one public health outcome of this event: direct flood deaths in Orleans and St. Bernard parishes of Louisiana. In particular, the risk of death for the flood-exposed population is estimated, mapped, and discussed. Of the nearly 1,500 deaths that Louisiana officially counts as Katrina deaths, approximately 600 are determined to be associated with exposure to floodwaters. Additionally, it is estimated that approximately 63,000 persons were exposed to floodwaters. The ratio of flood deaths to flood-exposed population, termed the flood fatality rate, provides an empirical measure of flood risk. Georeferenced datasets on both the flood deaths and the flood-exposed population are developed, and then used to estimate and map the flood fatality rate. For the overall event, the flood fatality rate is estimated to be 7 11 deaths per 1,000 persons exposed, which is consistent with other coastal flood disasters. At the blockgroup level, the highest values of the flood fatality rate are observed in the Lower Ninth Ward, while comparatively lower values are observed in New Orleans East. A preliminary univariate regression model with water depth as the independent variable is presented, and applied to Hurricane Gustav, which impacted the region in August 2008.
|
| [17] |
A simple model for the estimation of the number of fatalities due to floods in Central Europe [J]. |
| [18] |
Assessing the threat to life from dam failure [J].
|
| [19] |
Predicting loss of life in cases of dam failure and flash flood [J].https://doi.org/10.1111/j.1539-6924.1993.tb01069.x URL 摘要
This paper improves upon previous attempts to predict loss of life (LOL) from severe flooding events. An expression for LOL in terms of warning time (WT), the size of the population at risk (PAR), and the forcefulness of the flood waters (Force) is derived from the historical record of dam failures and flash flood cases via logistic regression. There is no evidence for an effect of prior flooding experience or an interaction between WT and PAR, as has been suggested elsewhere. Guidelines are suggested for the proper use of the final equations and the findings are discussed in relation to a theoretical model of flood fatalities.
|
| [20] |
Een verkennend onderzoek naar methoden ter bepaling van inundatieschade bij doorbraak,TNO report ref. 82-0644 .
|
| [21] |
Natural disasters trends [EB/OL]. |
| [22] |
A quantitative flood risk analysis methodology for urban areas with integration of social research data [J].https://doi.org/10.5194/nhess-12-2843-2012 URL [本文引用: 1] 摘要
Risk analysis has become a top priority for authorities and stakeholders in many European countries, with the aim of reducing flooding risk, considering the population's needs and improving risk awareness. Within this context, two methodological pieces have been developed in the period 2009--2011 within the SUFRI project (Sustainable Strategies of Urban Flood Risk Management with non-structural measures to cope with the residual risk, 2nd ERA-Net CRUE Funding Initiative). First, the "SUFRI Methodology for pluvial and river flooding risk assessment in urban areas to inform decision-making" provides a comprehensive and quantitative tool for flood risk analysis. Second, the "Methodology for investigation of risk awareness of the population concerned" presents the basis to estimate current risk from a social perspective and identify tendencies in the way floods are understood by citizens. Outcomes of both methods are integrated in this paper with the aim of informing decision making on non-structural protection measures. The results of two case studies are shown to illustrate practical applications of this developed approach. The main advantage of applying the methodology herein presented consists in providing a quantitative estimation of flooding risk before and after investing in non-structural risk mitigation measures. It can be of great interest for decision makers as it provides rational and solid information.
|
| [23] |
Hazus-MH flood manuals: Flood model technical manual [M]. |
| [24] |
Future Earth initial design report [R/OL]. [ |
| [25] |
A procedure for estimating loss of life caused by dam failure [R]. |
| [26] |
A global ranking of port cities with high exposure to climate extremes [J].https://doi.org/10.1007/s10584-010-9977-4 [本文引用: 1] 摘要
This paper presents a first estimate of the exposure of the world’s large port cities (population exceeding one million inhabitants in 2005) to coastal flooding due to sea-level rise and storm surge now and in the 2070s, taking into account scenarios of socio-economic and climate changes. The analysis suggests that about 40 million people (0.6% of the global population or roughly 1 in 10 of the total port city population in the cities considered) are currently exposed to a 1 in 100 year coastal flood event. For assets, the total value exposed in 2005 across all cities considered is estimated to be US$3,000 billion; corresponding to around 5% of global GDP in 2005 (both measured in international USD) with USA, Japan and the Netherlands being the countries with the highest values. By the 2070s, total population exposed could grow more than threefold due to the combined effects of sea-level rise, subsidence, population growth and urbanisation with asset exposure increasing to more than ten times current levels or approximately 9% of projected global GDP in this period. On the global-scale, population growth, socio-economic growth and urbanization are the most important drivers of the overall increase in exposure particularly in developing countries, as low-lying areas are urbanized. Climate change and subsidence can significantly exacerbate this increase in exposure. Exposure is concentrated in a few cities: collectively Asia dominates population exposure now and in the future and also dominates asset exposure by the 2070s. Importantly, even if the environmental or socio-economic changes were smaller than assumed here the underlying trends would remain. This research shows the high potential benefits from risk-reduction planning and policies at the city scale to address the issues raised by the possible growth in exposure.
|
| [27] |
|
| [28] |
Overstromingsrisico’s: een onderzoek naar de toepasbaarheid van risicomaten .
|
| [29] |
Global perspectives on loss of human life caused by floods [J].https://doi.org/10.1007/s11069-004-8891-3 [本文引用: 1] 摘要
Every year floods cause enormous damage all over the world. This study investigates loss of human life statistics for different types of floods and different regions on a global scale. The OFDA/CRED Database contains data on international disasters and is maintained by the Centre for Research on the Epidemiology of Disasters in Brussels (CRED) in cooperation with United States Office for Foreign Disaster Assistance (OFDA). Information from this source on a large number of flood events, which occurred between January 1975 and June 2002, is evaluated with respect to flood location and flood type. Due to the limited availability of information on coastal flood events, the scope of this study is limited to three types of freshwater flooding: river floods, flash floods and drainage problems. First, the development of loss of life statistics over time is discussed. Second, the dataset is analysed by region, by flood type and by the combination of type and region. The study shows that flash floods result in the highest average mortality per event (the number of fatalities divided by the number of affected persons). A cross analysis by flood type and location shows that average mortality is relatively constant for the different types over various continents, while the magnitude of the impacts (numbers of killed) and affected for a certain type varies between the different continents. On a worldwide scale Asian river floods are most significant in terms of number of persons killed and affected. Finally, a comparison with figures for other types of natural disasters shows that floods are the most significant disaster type in terms of the number of persons affected.
|
| [30] |
Loss of life estimation in flood risk assessment: Theory and applications [D]. |
| [31] |
Loss of life caused by the flooding of New Orleans after Hurricane Katrina: Analysis of the relationship between flood characteristics and mortality [J].https://doi.org/10.1111/j.1539-6924.2008.01190.x URL 摘要
In this article a preliminary analysis of the loss of life caused by Hurricane Katrina in the New Orleans metropolitan area is presented. The hurricane caused more than 1,100 fatalities in the state of Louisiana. A preliminary data set that gives information on the recovery locations and individual characteristics for 771 fatalities has been analyzed. One-third of the analyzed fatalities occurred outside the flooded areas or in hospitals and shelters in the flooded area. These fatalities were due to the adverse public health situation that developed after the floods. Two-thirds of the analyzed fatalities were most likely associated with the direct physical impacts of the flood and mostly caused by drowning. The majority of victims were elderly: nearly 60% of fatalities were over 65 years old. Similar to historical flood events, mortality rates were highest in areas near severe breaches and in areas with large water depths. An empirical relationship has been derived between the water depth and mortality and this has been compared with similar mortality functions proposed based on data for other flood events. The overall mortality among the exposed population for this event was approximately 1%, which is similar to findings for historical flood events. Despite the fact that the presented results are preliminary they give important insights into the determinants of loss of life and the relationship between mortality and flood characteristics.
|
| [32] |
|
| [33] |
Methods for the estimation of loss of life due to floods: A literature review and a proposal for a new method [J].https://doi.org/10.1007/s11069-008-9227-5 摘要
<a name="Abs1"></a>This article deals with methods for the estimation of loss of life due to flooding. These methods can be used to assess the flood risks and to identify mitigation strategies. The first part of this article contains a comprehensive review of existing literature. Methods have been developed for different types of floods in different regions. In general these methods relate the loss of life in the flooded area to the flood characteristics and the possibilities for evacuation and shelter. An evaluation showed that many of the existing methods do not take into account all of the most relevant determinants of loss of life and that they are often to a limited extent based on empirical data of historical flood events. In the second part of the article, a new method is proposed for the estimation of loss of life caused by the flooding of low-lying areas protected by flood defences. An estimate of the loss of life due to a flood event can be given based on: (1) information regarding the flood characteristics, (2) an analysis of the exposed population and evacuation, and (3) an estimate of the mortality amongst the exposed population. By analysing empirical information from historical floods, new mortality functions have been developed. These relate the mortality amongst the exposed population to the flood characteristics. Comparison of the outcomes of the proposed method with information from historical flood events shows that it gives an accurate approximation of the number of observed fatalities during these events. The method is applied to assess the consequences for a large-scale flooding of the area of South Holland, in the Netherlands. It is estimated that the analysed coastal flood scenario can lead to approximately 3,200 fatalities in this area.
|
| [34] |
Life safety modelling framework and performance measures to assess community protection systems: Application to tsunami emergency preparedness and dam safety management [D]. |
| [35] |
Developing fragility functions for tsunami damage estimation using numerical model and post-tsunami data from Banda Aceh, Indonesia [J].https://doi.org/10.1142/S0578563409002004 URL 摘要
ABSTRACT Fragility functions, as new measures for estimating structural damage and casualties due to tsunami attack, are developed by an integrated approach using numerical modeling of tsunami inundation and GIS analysis of post-tsunami survey data of the 2004 Sumatra– Andaman earthquake tsunami disaster, obtained from Banda Aceh, Indonesia. The fragility functions are expressed as the damage probabilities of structures or death ratio with regard to the hydrodynamic features of tsunami inundation flow, such as inundation depth, current velocity and hydrodynamic force. They lead to the new understandings of the relationship between local vulnerability and tsunami hazard in a quantitative manner.
|
| [36] |
Flood loss analysis and quantitative risk assessment in China [J].https://doi.org/10.1007/s11069-012-0180-y Magsci [本文引用: 2] 摘要
Abstract<br/>Risk assessment is a prerequisite for flood risk management. Practically, most of the decision making requires that the risks and costs of all risk mitigation options are evaluated in quantified terms. Therefore, a quantitative assessment of possible flood loss is very important, especially for emergency planning and pre-disaster preparedness. This paper presents a preliminary methodology and an operational approach for assessing the risk of flood loss to the population, crops, housing, and the economy at county level in China. The present work assesses the risk of loss for each element (people, crops, and so on) under low-, moderate-, and high-intensity flood using intensity-loss curves and loss rates based on historical flood data from 1990 to 2008. Results show that the counties with high flood risk are primarily located in North, East, Central, and South China, particularly in the lower reaches of rivers. On the other hand, the risk of most counties in the western region is generally lower than that of counties in the eastern region. However, for the entire country, the high-risk regions have both a substantial amount of rainfall and low terrain, making such regions highly prone to flooding. Moreover, these high-risk regions present both high population and wealth density.<br/>
|
| [37] |
Flood damage estimation beyond stage-damage functions: An Australian example [J].https://doi.org/10.1111/j.1753-318X.2009.01058.x URL [本文引用: 1] 摘要
ABSTRACT A number of factors influence the direct consequence of flooding. The most important are depth of inundation, velocity, duration of inundation and water quality and the interaction of these factors with human society. Although computer modelling techniques exist that can provide an estimate of these variables, this information is seldom used to estimate the impact of flooding on a community. This work describes the first step to improve this situation using data collected for the Swan River system in Perth, Western Australia. Here, it is shown that residential losses are underestimated when stage–damage functions or the velocity–stage–damage functions are used in isolation. This is because the functions are either limited to assessing partial damage or structural failure resulting from the movement of a house from its foundations. This demonstrates the need to use a combination of techniques to assess the direct cost of flooding.
|
| [38] |
Dynamic vulnerability analysis of population for flood disaster in urban area [J].
Vulnerability analysis is a key step of risk analysis of natural disaster. Based on information diffusion theory and incomplete information, it analyzes the changes of the affected population in urban flood and identifies the function relationship between the hazard (rainstorm) and disaster-bearing body (population), which is called vulnerability curve of population in flood disaster.This curve not only can present some changing extent of urban flood risk, but also could provide an important basis for integrated risk assessment of urban flood.
|
| [39] |
Physical vulnerability assessment for alpine hazards: State of the art and future needs [J].https://doi.org/10.1007/s11069-010-9632-4 [本文引用: 1] 摘要
Abstract<br/>Mountain hazards such as landslides, floods and avalanches pose a serious threat to human lives and development and can cause considerable damage to lifelines, critical infrastructure, agricultural lands, housing, public and private infrastructure and assets. The assessment of the vulnerability of the built environment to these hazards is a topic that is growing in importance due to climate change impacts. A proper understanding of vulnerability will lead to more effective risk assessment, emergency management and to the development of mitigation and preparedness activities all of which are designed to reduce the loss of life and economic costs. In this study, we are reviewing existing methods for vulnerability assessment related to mountain hazards. By analysing the existing approaches, we identify difficulties in their implementation (data availability, time consumption) and differences between them regarding their scale, the consideration of the hazardous phenomenon and its properties, the consideration of important vulnerability indicators and the use of technology such as GIS and remote sensing. Finally, based on these observations, we identify the future needs in the field of vulnerability assessment that include the user-friendliness of the method, the selection of all the relevant indicators, the transferability of the method, the inclusion of information concerning the hazard itself, the use of technology (GIS) and the provision of products such as vulnerability maps and the consideration of the temporal pattern of vulnerability.<br/>
|
| [40] |
Global trends in tropical cyclone risk [J].https://doi.org/10.1038/nclimate1410 URL [本文引用: 1] 摘要
The impact of tropical cyclones on humans depends on the number of people exposed and their vulnerability, as well as the frequency and intensity of storms. How will the cumulative effects of climate change, demography and vulnerability affect risk? Conventionally, reports assessing tropical cyclone risk trends are based on reported losses, but these figures are biased by improvements to information access. Here we present a new methodology based on thousands of physically observed events and related contextual parameters. We show that mortality risk depends on tropical cyclone intensity, exposure, levels of poverty and governance. Despite the projected reduction in the frequency of tropical cyclones, projected increases in both demographic pressure and tropical cyclone intensity over the next 20 years can be expected to greatly increase the number of people exposed per year and exacerbate disaster risk, despite potential progression in development and governance.
|
| [41] |
Assessing global exposure and vulnerability towards natural hazards: The disaster risk index [J].https://doi.org/10.5194/nhess-9-1149-2009 URL [本文引用: 1] 摘要
This paper presents a model of factors influencing levels of human losses from natural hazards at the global scale, for the period 1980鈥2000. This model was designed for the United Nations Development Programme as a building stone of the Disaster Risk Index (DRI), which aims at monitoring the evolution of risk. Assessing what countries are most at risk requires considering various types of hazards, such as droughts, floods, cyclones and earthquakes. Before assessing risk, these four hazards were modelled using GIS and overlaid with a model of population distribution in order to extract human exposure. Human vulnerability was measured by crossing exposure with selected socio-economic parameters. The model evaluates to what extent observed past losses are related to population exposure and vulnerability. Results reveal that human vulnerability is mostly linked with country development level and environmental quality. A classification of countries is provided, as well as recommendations on data improvement for future use of the model.
|
| [42] |
Analysis of human risks due to dam-break floods—part 1: A new model based on Bayesian networks [J].https://doi.org/10.1007/s11069-012-0275-5 [本文引用: 3] 摘要
Dam breaks have catastrophic consequences for human lives. This paper presents a new human risk analysis model (HURAM) using Bayesian networks for estimating human risks due to dam-break floods. A Bayesian network is constructed according to a logic structure of loss-of-life mechanisms. The nodes (parameters) and the arcs (inter-relationships) of the network are quantified with historical data, existing models and physical analyses. A dataset of 343 dam-failure cases with records of fatality is compiled for this purpose. Comparison between two existing models and the new model is made to test the new model. Finally, sensitivity analysis is conducted to identify the important parameters that lead to loss of life. The new model is able to take into account a large number of important parameters and their inter-relationships in a systematic structure; include the uncertainties of these parameters and their inter-relationships; incorporate information derived from physical analysis, empirical models and historical data; and update the predictions when information in specific cases is available. The application of this model to the study of human risks in a specific dam-break case is presented in a companion paper.<br/>
|
| [43] |
Estimating injury and loss of life in floods: A deterministic framework [J].https://doi.org/10.1007/s11069-004-4538-7 [本文引用: 1] 摘要
<a name="Abs1"></a>This paper presents an outline methodology and an operational framework for assessing and mapping the risk of death or serious harm to people from flooding, covering death and physical injuries as a direct and immediate consequence of deep and/or fast flowing floodwaters (usually by drowning), and deaths and physical injuries associated with the flood event (but occurring in the immediate aftermath). The main factors that affect death or injury to people during floods include flow velocity, flow depth, and the degree to which people are exposed to the flood. The exposure potential is related to such factors as the “suddenness” of flooding (and amount of flood warning), the extent of the floodplain, people’s location on the floodplain, and the character of their accommodation. In addition, risks to people are affected by social factors including their vulnerability and behaviour. A methodology is described for estimating the likely annual number of deaths/injuries. This is based on defining zones of different flood hazard and, for each zone, estimating the total number of people located there, the proportion that are likely to be exposed to a flood, and the proportion of those exposed who are likely to be injured or killed during a flood event. The results for each zone are combined to give an overall risk for each flood cell and/or community. The objective of the research reported here is to develop a method which could be applied using a map-based approach in which flood risks to people are calculated and displayed spatially for selected areas or communities. The information needed for each part of the process is described in the paper, and the further research to provide the required information is identified.
|
| [44] |
Building a model to estimate risk to life for European flood events[R]. London: Floodsite ,
|
| [45] |
Flood risks to people: Phase 1[R]. London, SW: Defra , |
| [46] |
RESCDAM loss of life caused by dam failure, the RESCDAM LOL method and its application to Kyrkösjärvi dam in Seinäjoki [R]. |
| [47] |
RCEM-reclamation consequence estimating methodology: Guidelines for estimating life loss for dam safety risk analysis [R].
|
| [48] |
Global assessment report on disaster risk reduction (2009) [R]. |
| [49] |
Reducing vulnerability and exposure to disasters: Asia-Pacific disaster report 2012 [R]. |
| [50] |
Tweede waterkeringen Hoeksche Waard, berekening van het aantal slachtoffers bij verschillende inundatiescenario’s [R]. |
| [51] |
Methode voor de bepaling van het aantal doden als gevolg van inundatie [R].
|
| [52] |
Spatial-temporal rainfall modelling for flood risk estimation [J].https://doi.org/10.1007/s00477-005-0011-8 [本文引用: 1] 摘要
Some recent developments in the stochastic modelling of single site and spatial rainfall are summarised. Alternative single site models based on Poisson cluster processes are introduced, fitting methods are discussed, and performance is compared for representative UK hourly data. The representation of sub-hourly rainfall is discussed, and results from a temporal disaggregation scheme are presented. Extension of the Poisson process methods to spatial-temporal rainfall, using radar data, is reported. Current methods assume spatial and temporal stationarity; work in progress seeks to relax these restrictions. Unlike radar data, long sequences of daily raingauge data are commonly available, and the use of generalized linear models (GLMs) (which can represent both temporal and spatial non-stationarity) to represent the spatial structure of daily rainfall based on raingauge data is illustrated for a network in the North of England. For flood simulation, disaggregation of daily rainfall is required. A relatively simple methodology is described, in which a single site Poisson process model provides hourly sequences, conditioned on the observed or GLM-simulated daily data. As a first step, complete spatial dependence is assumed. Results from the River Lee catchment, near London, are promising. A relatively comprehensive set of methodologies is thus provided for hydrological application.
|
| [53] |
An empirical model of fatalities and injuries due to floods in Japan [J].https://doi.org/10.1111/j.1752-1688.2006.tb04500.x URL 摘要
This paper provides a framework for analyzing flood fatalities and injuries, and it describes the derivation of a generalized flood risk (i.e., flood consequenc
|

/
| 〈 |
|
〉 |