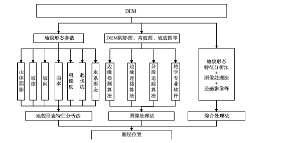
Extraction of active fault location and active fault surface deformation features is essential for the study of active fault systems, and a large number of studies have been carried out on fault extraction based on Digital Elevation Model (DEM). This article summarizes the active fault extraction methods using DEM of lower than 30 m resolution and very-high resolution DEM, such as Light Detection and Ranging (LiDAR) DEM and Structure from Motion (SfM) DEM. The fault extraction methods can be divided mainly into three categories: geomorphic feature interpretation, image interpretation and multiple interpretation. Geomorphic feature interpretation is based on GIS spatial analyses. Image interpretation identifies faults by examining linear variation of surface deformation through image processing algorithms. Multiple interpretation combines the above two methods with remote sensing image processing. Meanwhile, this article reviews the most recent progress in the extraction of surface deformation features using DEM, and enumerates the extraction of fault scarp and deformed drainage characteristics. With the progress in high-resolution DEM, DEM and its spatial analysis techniques have become a conventional geoscience research method. The integration of this method with field research, remote sensing, and dating techniques can provide a strong technical support to quantitative study in fault research.
Keywords:Digital Elevation Model (DEM)
;
LiDAR DEM
;
active fault
;
surface deformation of fault
ZHANGXinxin. DEM application in the extraction of active fault location and active fault surface deformation features[J]. 地理科学进展, 2015, 34(10): 1288-1296 https://doi.org/10.18306/dlkxjz.2015.10.009
1 引言
断层位置的识别和提取是活动断层研究的基础和前提,断层活动形成的地表变形变位是用来确定断层位置的基本依据,因此断层的位置分布及其地表变形变位特征的准确识别(Burbank et al, 2011),是评价和研究一个断层系统的关键。
野外调查结合地势图、地质图等进行综合分析,是研究断层最传统、也是最经典的方法,该方法的局限是调查周期长,工作量大,一些偏远地区难以到达。随着遥感影像的出现及其分辨率的不断提高,基于遥感影像解译断层位置受到学者的关注(Koike et al, 1995; Novak et al, 2000; Marghany et al, 2010),但是遥感影像的解译通常难以定量地获取垂直方向的断层地表变形变位数据。数字高程模型(DEM)是对地表形态特征的模拟和数字化表达,同时具有平面和高度位置信息,可有效应用于构造地貌的定量化研究,在断层的研究中受到很大的瞩目。
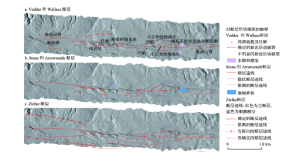
图像处理法将DEM及其地貌特征专题图视为简单的图像进行处理(Gloaguen et al, 2007),处理方法最初来源于遥感影像处理,依靠DEM影像、阴影图、坡度图等的色调变化来检测线性构造。Argialas等(2004)在希腊Nisyros岛基于遥感影像、地形图和DEM使用边缘检测(如Canny、Rothwell、Black、Bezdek、Iverson-Zucker、EDISON、SUSAN等)和边缘连接技术(如Hough变换)提取线性构造,均取得了较好的提取效果。与其他算法相比,分段追踪(Segment-tracing)算法(Masoud et al, 2011a, 2011b)能够只跟踪连续的线性构造,且能够提取平行于光照方向的位于阴影区的线性构造。
此外,遥感软件如PCI、ERDAS等中检测线性构造的模块被广泛应用于断层线性结构的提取(Flores-Prieto et al, 2015)。Mallast等(2011)在死海的西部集水盆地基于30 m分辨率的DEM进行4个方向的线性滤波,将4张图融合为一张凸显4个方向线性构造的影像,然后使用ERDAS中基于对象的影像分析和PCI Geomatic中的Line算法分别解译线性构造,两种方法抽取的结果比较相似,但是基于对象分析能够抽取较小的线,而PCI Geomatic中的Line算法则能够抽取较大的线,通过GIS分析将两种方法提取的结果整合得到一个全面互补的线性构造图。
2.1.3 综合处理方法
除了以上两种常见的基于DEM提取断层位置的方法外,还可结合遥感影像等进行综合分析来判别断层。遥感影像的获取建立在一定光学参数的基础上且只能定量获取二维信息,而DEM能定量地反映地表的高程信息且在建立阴影图时可以人为模拟任意光照角度,由此弥补了遥感影像的不足之处。遥感影像分辨率较高以及影像中地物颜色、纹理的准确辨认可以弥补较低分辨率DEM的不足,有助于地物的直观识别。因此,通过高分辨率遥感影像与较低分辨率DEM的结合 (Chorowicz et al, 1999; Samy et al, 2012),可以进行地形三维叠加,从而更准确地从多角度对构造信息进行提取。在利比亚西北部的Eljufra地区,Saadi等(2008)对遥感影像进行了影像增强,基于影像的色调、纹理、河网形态等对研究区的线性构造进行了解译,然后将遥感影像叠加到DEM阴影图上进行三维模拟,解译出沿NNW-SSE和NNE-SSW两个方向的线性构造,其中沿NNE-SSW走向的线性构造首次被识别。同时基于重力数据提取出地表下的构造线,将其与地质图解译的已有的构造线对比,发现地表和地下的构造相对比较吻合。Saadi等(2011)在上述研究的基础上基于DEM提取水系,通过识别直线状沟谷、线状凹陷及坡度大的陡坎等确定线性构造位置,还通过已有地质图和野外观察解译了地质构造线,将其与遥感数据解译的构造线综合,对古达米斯(Ghadames)流域的起源和演化进行了定量研究,重新认识了古达米斯流域及其接壤的利比亚西北部其他地区的构造形态。Saadi等(2008, 2011)注重多源数据结合,全面地解译了断层的构造信息。地质图上的断层信息,受比例尺和获取方法不同的影响,与DEM和遥感影像所反映的线性构造信息有一定的位置差异,但其对提取的断层具有很好的验证和指导作用。
Neotectonics in the eastern North Anatolian fault region (Turkey) advocates crustal extension: mapping from SAR ERS imagery and Digital Elevation Model
[J]. Journal of Structural Geology, 21(5): 511-532.
a. Auto-detection and integration of tectonically significant lineaments from SRTM DEM and remotely-sensed geophysical data
[J]. ISPRS Journal of Photogrammetry and Remote Sensing, 66(6): 818-832.
[40]
Masoud AA, KoikeK.2011
b. Morphotectonics inferred from the analysis of topographic lineaments auto-detected from DEMs: application and validation for the Sinai Peninsula, Egypt
Application of terrain analysis to the mapping and spatial pattern analysis of subsurface geological fractures of Kuala Lumpur limestone bedrock, Malaysia
[J]. International Journal of Remote Sensing, 33(10): 3176-3196.
High-resolution topography-derived offsets along the 1857 Fort Tejon earthquake rupture trace, San Andreas Fault
[J]. Bulletin of the Seismological Society of America, 102(3): 1135-1154.
[65]
ZielkeO, Arrowsmith JR.2012.
LaDiCaoz and LiDARimager-MATLAB GUIs for LiDAR data handling and lateral displacement measurement
[J]. Geosphere, 8(1): 206-221.
机载激光雷达扫描揭示海原断裂带微地貌的精细结构
2
2013
... 在利用DEM的活动断层提取的研究中,由于常见DEM分辨率常低于30 m,无法识别小尺度的地表变形变位特征和精确的断层位置分布,而微小的地表变形变位是断层最新活动的证据,精确度不足的断层位置及其地表形变特征信息,会引起对断层位置分布、断层长度、断层活动强度及未来地震强度等的错误判断.近年来,机载激光雷达(Light Detection and Ranging,LiDAR) DEM等高分辨率DEM的出现,为解决这一问题提供了强有力的数据支持.如何深入利用高分辨率DEM数据,成为目前活动断层研究进一步发展所面临的挑战和机遇(Haugerud et al, 2003; Cunningham et al, 2006; Arrowsmith et al, 2009; Wechsler et al, 2009; Zielke, 2010; Cowgill et al, 2012; Grebby et al, 2012; Oskin et al, 2012; Lin et al, 2013; 刘静等, 2013; Nissen, 2014; Tarolli, 2014). ...
... 在利用DEM的活动断层提取的研究中,由于常见DEM分辨率常低于30 m,无法识别小尺度的地表变形变位特征和精确的断层位置分布,而微小的地表变形变位是断层最新活动的证据,精确度不足的断层位置及其地表形变特征信息,会引起对断层位置分布、断层长度、断层活动强度及未来地震强度等的错误判断.近年来,机载激光雷达(Light Detection and Ranging,LiDAR) DEM等高分辨率DEM的出现,为解决这一问题提供了强有力的数据支持.如何深入利用高分辨率DEM数据,成为目前活动断层研究进一步发展所面临的挑战和机遇(Haugerud et al, 2003; Cunningham et al, 2006; Arrowsmith et al, 2009; Wechsler et al, 2009; Zielke, 2010; Cowgill et al, 2012; Grebby et al, 2012; Oskin et al, 2012; Lin et al, 2013; 刘静等, 2013; Nissen, 2014; Tarolli, 2014). ...
Comparison of edge detection and Hough transform techniques for the extraction of geologic features
0
2004
Tectonic geomorphology of the San Andreas Fault zone from high resolution topography: an example from the Cholame segment
1
2009
... 在利用DEM的活动断层提取的研究中,由于常见DEM分辨率常低于30 m,无法识别小尺度的地表变形变位特征和精确的断层位置分布,而微小的地表变形变位是断层最新活动的证据,精确度不足的断层位置及其地表形变特征信息,会引起对断层位置分布、断层长度、断层活动强度及未来地震强度等的错误判断.近年来,机载激光雷达(Light Detection and Ranging,LiDAR) DEM等高分辨率DEM的出现,为解决这一问题提供了强有力的数据支持.如何深入利用高分辨率DEM数据,成为目前活动断层研究进一步发展所面临的挑战和机遇(Haugerud et al, 2003; Cunningham et al, 2006; Arrowsmith et al, 2009; Wechsler et al, 2009; Zielke, 2010; Cowgill et al, 2012; Grebby et al, 2012; Oskin et al, 2012; Lin et al, 2013; 刘静等, 2013; Nissen, 2014; Tarolli, 2014). ...
Analysis of late Holocene faulting within an active rift using LiDAR, Taupo Rift, New Zealand
0
2010
Characterization of active fault scarps from LiDAR data: a case study from Central Apennines (Italy)
0
2013
Tectonic Geomorphology
1
2011
... 断层位置的识别和提取是活动断层研究的基础和前提,断层活动形成的地表变形变位是用来确定断层位置的基本依据,因此断层的位置分布及其地表变形变位特征的准确识别(Burbank et al, 2011),是评价和研究一个断层系统的关键. ...
Characterizing the Hsincheng active fault in northern Taiwan using airborne LiDAR data: detailed geomorphic features and their structural implications
1
2007
... 断层陡坎是断层活动形成的典型的地表变形变位之一,记录着一次或多次断层活动的垂直位错量.结合陡坎的形变特征和陡坎的年代数据,可以用来求取断层的平均活动速率,研究断层的活动强度和结构特征(Hooper et al, 2003; Sherrod et al, 2004; Chan et al, 2007; Kondo et al, 2008; Petit, Gunnell, et al, 2009; Petit, Meyer, et al, 2009; Ganev et al, 2010; Hilley et al, 2010; Wiatr et al, 2013).Begg等(2010)在新西兰陶坡裂谷扩张最快的朗伊泰基平原地区,基于LiDAR DEM制作了阴影图,将半透明显示的阴影图叠加到彩色渲染过的LiDAR DEM上,结合坡度图和等高线图识别错断水系、陡坎等的准确位置,并解译出122条断层.断层陡坎记录着断层的垂直位移量,为了定量地研究断层,在平行于断层走向的断层两侧及垂直于断层走向横穿断层,以200 m为间隔共抽取了1000多条剖面线,测得断层的垂直错动量.研究发现,朗伊泰基平原上各断层的滑动速率差异较大,通过计算每个断层的最大错动量与长度的比值(D/L),发现大多数的断层带D/L值都比Wells等(1994)得到的正断层的经验值高,说明这些地区发生了多次地震.Begg等基于LiDAR DEM提取的断层数量比前人研究识别得多,且对断层的位错量、滑动速率等都有了新的认识.Brunori等(2013)基于1 m分辨率的LiDAR DEM,对意大利亚平宁山脉Pettino断层的4个90~280 m的陡坎的高度、长度、坡度和坡向等特征进行了研究,通过阴影图、坡度图和坡向图中地形和坡度的突然变化来辨认陡坎的上下界限,同时,利用1 m分辨率的IKONOS全色影像和0.6 m分辨率的QuickBird影像来区别断层陡坎与人造物,最后精确提取了陡坎的相对高度、坡度、坡向等信息,制作了陡坎的3D示图,结合年代数据,估算了断层的滑动速率. ...
Quantitative study of tectonic geomorphology along Haiyuan fault based on airborne LiDAR
The Tana Basin, Ethiopia: intra-plateau uplift, rifting and subsidence
1
1998
... 水系形态对流域内断层活动的响应极为敏感,因此水系形态分析也是断层构造解译的重要技术手段.根据不同水系在同一直线上展布、主河流两侧的水系密度差异、河流系统拐弯且呈直角等水系特征可以解译断层(Jackson et al, 1996; Chorowicz et al, 1998; Dumont et al, 2005; Guarnieri et al, 2008; Štěpančíková et al, 2008; Walker et al, 2012). ...
Neotectonics in the eastern North Anatolian fault region (Turkey) advocates crustal extension: mapping from SAR ERS imagery and Digital Elevation Model
1
1999
... 除了以上两种常见的基于DEM提取断层位置的方法外,还可结合遥感影像等进行综合分析来判别断层.遥感影像的获取建立在一定光学参数的基础上且只能定量获取二维信息,而DEM能定量地反映地表的高程信息且在建立阴影图时可以人为模拟任意光照角度,由此弥补了遥感影像的不足之处.遥感影像分辨率较高以及影像中地物颜色、纹理的准确辨认可以弥补较低分辨率DEM的不足,有助于地物的直观识别.因此,通过高分辨率遥感影像与较低分辨率DEM的结合 (Chorowicz et al, 1999; Samy et al, 2012),可以进行地形三维叠加,从而更准确地从多角度对构造信息进行提取.在利比亚西北部的Eljufra地区,Saadi等(2008)对遥感影像进行了影像增强,基于影像的色调、纹理、河网形态等对研究区的线性构造进行了解译,然后将遥感影像叠加到DEM阴影图上进行三维模拟,解译出沿NNW-SSE和NNE-SSW两个方向的线性构造,其中沿NNE-SSW走向的线性构造首次被识别.同时基于重力数据提取出地表下的构造线,将其与地质图解译的已有的构造线对比,发现地表和地下的构造相对比较吻合.Saadi等(2011)在上述研究的基础上基于DEM提取水系,通过识别直线状沟谷、线状凹陷及坡度大的陡坎等确定线性构造位置,还通过已有地质图和野外观察解译了地质构造线,将其与遥感数据解译的构造线综合,对古达米斯(Ghadames)流域的起源和演化进行了定量研究,重新认识了古达米斯流域及其接壤的利比亚西北部其他地区的构造形态.Saadi等(2008, 2011)注重多源数据结合,全面地解译了断层的构造信息.地质图上的断层信息,受比例尺和获取方法不同的影响,与DEM和遥感影像所反映的线性构造信息有一定的位置差异,但其对提取的断层具有很好的验证和指导作用. ...
Interactive terrain visualization enables virtual field work during rapid scientific response to the 2010 Haiti earthquake
1
2012
... 在利用DEM的活动断层提取的研究中,由于常见DEM分辨率常低于30 m,无法识别小尺度的地表变形变位特征和精确的断层位置分布,而微小的地表变形变位是断层最新活动的证据,精确度不足的断层位置及其地表形变特征信息,会引起对断层位置分布、断层长度、断层活动强度及未来地震强度等的错误判断.近年来,机载激光雷达(Light Detection and Ranging,LiDAR) DEM等高分辨率DEM的出现,为解决这一问题提供了强有力的数据支持.如何深入利用高分辨率DEM数据,成为目前活动断层研究进一步发展所面临的挑战和机遇(Haugerud et al, 2003; Cunningham et al, 2006; Arrowsmith et al, 2009; Wechsler et al, 2009; Zielke, 2010; Cowgill et al, 2012; Grebby et al, 2012; Oskin et al, 2012; Lin et al, 2013; 刘静等, 2013; Nissen, 2014; Tarolli, 2014). ...
Application of airborne LiDAR to mapping seismogenic faults in forested mountainous terrain, southeastern Alps, Slovenia
2
2006
... 在利用DEM的活动断层提取的研究中,由于常见DEM分辨率常低于30 m,无法识别小尺度的地表变形变位特征和精确的断层位置分布,而微小的地表变形变位是断层最新活动的证据,精确度不足的断层位置及其地表形变特征信息,会引起对断层位置分布、断层长度、断层活动强度及未来地震强度等的错误判断.近年来,机载激光雷达(Light Detection and Ranging,LiDAR) DEM等高分辨率DEM的出现,为解决这一问题提供了强有力的数据支持.如何深入利用高分辨率DEM数据,成为目前活动断层研究进一步发展所面临的挑战和机遇(Haugerud et al, 2003; Cunningham et al, 2006; Arrowsmith et al, 2009; Wechsler et al, 2009; Zielke, 2010; Cowgill et al, 2012; Grebby et al, 2012; Oskin et al, 2012; Lin et al, 2013; 刘静等, 2013; Nissen, 2014; Tarolli, 2014). ...
Digital terrain analysis using Landsat-7 ETM+ imagery and SRTM DEM: a case study of Nevsehir Province (Cappadocia), Turkey
0
2008
Quantifying geological structures of the Nigde Province in central Anatolia, Turkey using SRTM DEM data
0
2009
Morphologic evidence of active motion of the Zambapala Fault, Gulf of Guayaquil (Ecuador)
1
2005
... 水系形态对流域内断层活动的响应极为敏感,因此水系形态分析也是断层构造解译的重要技术手段.根据不同水系在同一直线上展布、主河流两侧的水系密度差异、河流系统拐弯且呈直角等水系特征可以解译断层(Jackson et al, 1996; Chorowicz et al, 1998; Dumont et al, 2005; Guarnieri et al, 2008; Štěpančíková et al, 2008; Walker et al, 2012). ...
LiDAR mapping of faults in Houston, Texas, USA
0
2008
Morphotectonic interpretation of the Makuyuni catchment in Northern Tanzania using DEM and SAR data
1
2015
... 此外,遥感软件如PCI、ERDAS等中检测线性构造的模块被广泛应用于断层线性结构的提取(Flores-Prieto et al, 2015).Mallast等(2011)在死海的西部集水盆地基于30 m分辨率的DEM进行4个方向的线性滤波,将4张图融合为一张凸显4个方向线性构造的影像,然后使用ERDAS中基于对象的影像分析和PCI Geomatic中的Line算法分别解译线性构造,两种方法抽取的结果比较相似,但是基于对象分析能够抽取较小的线,而PCI Geomatic中的Line算法则能够抽取较大的线,通过GIS分析将两种方法提取的结果整合得到一个全面互补的线性构造图. ...
Quantitative topographic method of fault morphology recognition
1
1996
... 基于较低分辨率DEM解译断层位置最常用的方法是地貌形态特征分析法,即通过地表高程、坡度、坡向、曲率、粗糙度、起伏度以及水系形态等分析,结合研究者的专业知识,识别断层引起的地表变形变位及其形态参数的变化,从而确定断层的位置(Florinsky et al, 1996). ...
DEM-based morphometry of range-front escarpments in Attica, central Greece, and its relation to fault slip rates
Rates of extension along the Fish Lake Valley fault and transtensional deformation in the Eastern California shear zone-Walker Lane belt
1
2010
... 断层陡坎是断层活动形成的典型的地表变形变位之一,记录着一次或多次断层活动的垂直位错量.结合陡坎的形变特征和陡坎的年代数据,可以用来求取断层的平均活动速率,研究断层的活动强度和结构特征(Hooper et al, 2003; Sherrod et al, 2004; Chan et al, 2007; Kondo et al, 2008; Petit, Gunnell, et al, 2009; Petit, Meyer, et al, 2009; Ganev et al, 2010; Hilley et al, 2010; Wiatr et al, 2013).Begg等(2010)在新西兰陶坡裂谷扩张最快的朗伊泰基平原地区,基于LiDAR DEM制作了阴影图,将半透明显示的阴影图叠加到彩色渲染过的LiDAR DEM上,结合坡度图和等高线图识别错断水系、陡坎等的准确位置,并解译出122条断层.断层陡坎记录着断层的垂直位移量,为了定量地研究断层,在平行于断层走向的断层两侧及垂直于断层走向横穿断层,以200 m为间隔共抽取了1000多条剖面线,测得断层的垂直错动量.研究发现,朗伊泰基平原上各断层的滑动速率差异较大,通过计算每个断层的最大错动量与长度的比值(D/L),发现大多数的断层带D/L值都比Wells等(1994)得到的正断层的经验值高,说明这些地区发生了多次地震.Begg等基于LiDAR DEM提取的断层数量比前人研究识别得多,且对断层的位错量、滑动速率等都有了新的认识.Brunori等(2013)基于1 m分辨率的LiDAR DEM,对意大利亚平宁山脉Pettino断层的4个90~280 m的陡坎的高度、长度、坡度和坡向等特征进行了研究,通过阴影图、坡度图和坡向图中地形和坡度的突然变化来辨认陡坎的上下界限,同时,利用1 m分辨率的IKONOS全色影像和0.6 m分辨率的QuickBird影像来区别断层陡坎与人造物,最后精确提取了陡坎的相对高度、坡度、坡向等信息,制作了陡坎的3D示图,结合年代数据,估算了断层的滑动速率. ...
Optimization of legacy LiDAR data sets for measuring near-field earthquake displacements
1
2014
... 差分LiDAR技术能够定量获取地震变形的三维空间信息(Oskin et al, 2012; Glennie et al, 2014).Nissen等(2014)利用差分LiDAR技术测量了日本两个地震的断层带变形,地震带均被植被覆盖,研究利用震前2 m分辨率和震后1 m分辨率的LiDAR DEM,基于ICP(Iterative Closest Point)算法抽取了地震造成的三维位移量和旋转量,结果证明在其他遥感技术很难恢复变形位移的近地面和密集植被覆盖区域,差分LiDAR DEM能够较好地认识断层的滑动变形.Johnson等(2014)首次在植被稀少和矮小的华盛顿街和戈尔韦湖路两个区域将SfM技术应用于断层地形的研究中,使用ICP算法进行差分运算,同时将SfM获取的点云数据分别与机载LiDAR数据和地面LiDAR数据进行对比,指出SfM技术与一些简单的差分算法结合将成为测量和监测断层详细变形和滑坡、断层陡坎退化及裂点后退等地形变化有力的工具. ...
Automatic extraction of faults and fractal analysis from remote sensing data
1
2007
... 图像处理法将DEM及其地貌特征专题图视为简单的图像进行处理(Gloaguen et al, 2007),处理方法最初来源于遥感影像处理,依靠DEM影像、阴影图、坡度图等的色调变化来检测线性构造.Argialas等(2004)在希腊Nisyros岛基于遥感影像、地形图和DEM使用边缘检测(如Canny、Rothwell、Black、Bezdek、Iverson-Zucker、EDISON、SUSAN等)和边缘连接技术(如Hough变换)提取线性构造,均取得了较好的提取效果.与其他算法相比,分段追踪(Segment-tracing)算法(Masoud et al, 2011a, 2011b)能够只跟踪连续的线性构造,且能够提取平行于光照方向的位于阴影区的线性构造. ...
Application of airborne LiDAR data and airborne multispectral imagery to structural mapping of the upper section of the Troodos ophiolite, Cyprus
2
2012
... 在利用DEM的活动断层提取的研究中,由于常见DEM分辨率常低于30 m,无法识别小尺度的地表变形变位特征和精确的断层位置分布,而微小的地表变形变位是断层最新活动的证据,精确度不足的断层位置及其地表形变特征信息,会引起对断层位置分布、断层长度、断层活动强度及未来地震强度等的错误判断.近年来,机载激光雷达(Light Detection and Ranging,LiDAR) DEM等高分辨率DEM的出现,为解决这一问题提供了强有力的数据支持.如何深入利用高分辨率DEM数据,成为目前活动断层研究进一步发展所面临的挑战和机遇(Haugerud et al, 2003; Cunningham et al, 2006; Arrowsmith et al, 2009; Wechsler et al, 2009; Zielke, 2010; Cowgill et al, 2012; Grebby et al, 2012; Oskin et al, 2012; Lin et al, 2013; 刘静等, 2013; Nissen, 2014; Tarolli, 2014). ...
The response of drainage basins to the late Quaternary tectonics in the Sicilian side of the Messina Strait (NE Sicily)
1
2008
... 水系形态对流域内断层活动的响应极为敏感,因此水系形态分析也是断层构造解译的重要技术手段.根据不同水系在同一直线上展布、主河流两侧的水系密度差异、河流系统拐弯且呈直角等水系特征可以解译断层(Jackson et al, 1996; Chorowicz et al, 1998; Dumont et al, 2005; Guarnieri et al, 2008; Štěpančíková et al, 2008; Walker et al, 2012). ...
High-resolution lidar topography of the Puget Lowland, Washington
1
2003
... 在利用DEM的活动断层提取的研究中,由于常见DEM分辨率常低于30 m,无法识别小尺度的地表变形变位特征和精确的断层位置分布,而微小的地表变形变位是断层最新活动的证据,精确度不足的断层位置及其地表形变特征信息,会引起对断层位置分布、断层长度、断层活动强度及未来地震强度等的错误判断.近年来,机载激光雷达(Light Detection and Ranging,LiDAR) DEM等高分辨率DEM的出现,为解决这一问题提供了强有力的数据支持.如何深入利用高分辨率DEM数据,成为目前活动断层研究进一步发展所面临的挑战和机遇(Haugerud et al, 2003; Cunningham et al, 2006; Arrowsmith et al, 2009; Wechsler et al, 2009; Zielke, 2010; Cowgill et al, 2012; Grebby et al, 2012; Oskin et al, 2012; Lin et al, 2013; 刘静等, 2013; Nissen, 2014; Tarolli, 2014). ...
DEM-based identification of fluvial knickzones and its application to Japanese mountain rivers
1
2006
... 河流能够地形能够较好地记录断层活动,不同规模水系的位错特征是活动断层研究的重要参数,国内外的学者对此开展了大量的研究,取得了令人瞩目的成果(Hayakawa et al, 2006; Zielke, 2010; Ludwig et al, 2012; Wei et al, 2015). ...
Morphologic dating of fault scarps using airborne laser swath mapping (ALSM) data
1
2010
... 断层陡坎是断层活动形成的典型的地表变形变位之一,记录着一次或多次断层活动的垂直位错量.结合陡坎的形变特征和陡坎的年代数据,可以用来求取断层的平均活动速率,研究断层的活动强度和结构特征(Hooper et al, 2003; Sherrod et al, 2004; Chan et al, 2007; Kondo et al, 2008; Petit, Gunnell, et al, 2009; Petit, Meyer, et al, 2009; Ganev et al, 2010; Hilley et al, 2010; Wiatr et al, 2013).Begg等(2010)在新西兰陶坡裂谷扩张最快的朗伊泰基平原地区,基于LiDAR DEM制作了阴影图,将半透明显示的阴影图叠加到彩色渲染过的LiDAR DEM上,结合坡度图和等高线图识别错断水系、陡坎等的准确位置,并解译出122条断层.断层陡坎记录着断层的垂直位移量,为了定量地研究断层,在平行于断层走向的断层两侧及垂直于断层走向横穿断层,以200 m为间隔共抽取了1000多条剖面线,测得断层的垂直错动量.研究发现,朗伊泰基平原上各断层的滑动速率差异较大,通过计算每个断层的最大错动量与长度的比值(D/L),发现大多数的断层带D/L值都比Wells等(1994)得到的正断层的经验值高,说明这些地区发生了多次地震.Begg等基于LiDAR DEM提取的断层数量比前人研究识别得多,且对断层的位错量、滑动速率等都有了新的认识.Brunori等(2013)基于1 m分辨率的LiDAR DEM,对意大利亚平宁山脉Pettino断层的4个90~280 m的陡坎的高度、长度、坡度和坡向等特征进行了研究,通过阴影图、坡度图和坡向图中地形和坡度的突然变化来辨认陡坎的上下界限,同时,利用1 m分辨率的IKONOS全色影像和0.6 m分辨率的QuickBird影像来区别断层陡坎与人造物,最后精确提取了陡坎的相对高度、坡度、坡向等信息,制作了陡坎的3D示图,结合年代数据,估算了断层的滑动速率. ...
Application of high-resolution, interferometric DEMs to geomorphic studies of fault scarps, Fish Lake Valley, Nevada-California, USA
1
2003
... 断层陡坎是断层活动形成的典型的地表变形变位之一,记录着一次或多次断层活动的垂直位错量.结合陡坎的形变特征和陡坎的年代数据,可以用来求取断层的平均活动速率,研究断层的活动强度和结构特征(Hooper et al, 2003; Sherrod et al, 2004; Chan et al, 2007; Kondo et al, 2008; Petit, Gunnell, et al, 2009; Petit, Meyer, et al, 2009; Ganev et al, 2010; Hilley et al, 2010; Wiatr et al, 2013).Begg等(2010)在新西兰陶坡裂谷扩张最快的朗伊泰基平原地区,基于LiDAR DEM制作了阴影图,将半透明显示的阴影图叠加到彩色渲染过的LiDAR DEM上,结合坡度图和等高线图识别错断水系、陡坎等的准确位置,并解译出122条断层.断层陡坎记录着断层的垂直位移量,为了定量地研究断层,在平行于断层走向的断层两侧及垂直于断层走向横穿断层,以200 m为间隔共抽取了1000多条剖面线,测得断层的垂直错动量.研究发现,朗伊泰基平原上各断层的滑动速率差异较大,通过计算每个断层的最大错动量与长度的比值(D/L),发现大多数的断层带D/L值都比Wells等(1994)得到的正断层的经验值高,说明这些地区发生了多次地震.Begg等基于LiDAR DEM提取的断层数量比前人研究识别得多,且对断层的位错量、滑动速率等都有了新的认识.Brunori等(2013)基于1 m分辨率的LiDAR DEM,对意大利亚平宁山脉Pettino断层的4个90~280 m的陡坎的高度、长度、坡度和坡向等特征进行了研究,通过阴影图、坡度图和坡向图中地形和坡度的突然变化来辨认陡坎的上下界限,同时,利用1 m分辨率的IKONOS全色影像和0.6 m分辨率的QuickBird影像来区别断层陡坎与人造物,最后精确提取了陡坎的相对高度、坡度、坡向等信息,制作了陡坎的3D示图,结合年代数据,估算了断层的滑动速率. ...
LiDAR-assisted identification of an active fault near Truckee, California
The structural evolution of active fault and fold systems in central Otago, New Zealand: evidence revealed by drainage patterns
1
1996
... 水系形态对流域内断层活动的响应极为敏感,因此水系形态分析也是断层构造解译的重要技术手段.根据不同水系在同一直线上展布、主河流两侧的水系密度差异、河流系统拐弯且呈直角等水系特征可以解译断层(Jackson et al, 1996; Chorowicz et al, 1998; Dumont et al, 2005; Guarnieri et al, 2008; Štěpančíková et al, 2008; Walker et al, 2012). ...
Rapid mapping of ultrafine fault zone topography with structure from motion
0
2014
Extraction of morphotectonic features from DEMs: development and applications for study areas in Hungary and NW Greece
0
2005
Morphometric analysis and tectonic interpretation of digital terrain data: a case study
0
2003
Lineament analysis of satellite images using a segment tracing algorithm (STA)
1
1995
... 野外调查结合地势图、地质图等进行综合分析,是研究断层最传统、也是最经典的方法,该方法的局限是调查周期长,工作量大,一些偏远地区难以到达.随着遥感影像的出现及其分辨率的不断提高,基于遥感影像解译断层位置受到学者的关注(Koike et al, 1995; Novak et al, 2000; Marghany et al, 2010),但是遥感影像的解译通常难以定量地获取垂直方向的断层地表变形变位数据.数字高程模型(DEM)是对地表形态特征的模拟和数字化表达,同时具有平面和高度位置信息,可有效应用于构造地貌的定量化研究,在断层的研究中受到很大的瞩目. ...
A fault scarp in an urban area identified by LiDAR survey: a case study on the Itoigawa-Shizuoka Tectonic Line, central Japan
1
2008
... 断层陡坎是断层活动形成的典型的地表变形变位之一,记录着一次或多次断层活动的垂直位错量.结合陡坎的形变特征和陡坎的年代数据,可以用来求取断层的平均活动速率,研究断层的活动强度和结构特征(Hooper et al, 2003; Sherrod et al, 2004; Chan et al, 2007; Kondo et al, 2008; Petit, Gunnell, et al, 2009; Petit, Meyer, et al, 2009; Ganev et al, 2010; Hilley et al, 2010; Wiatr et al, 2013).Begg等(2010)在新西兰陶坡裂谷扩张最快的朗伊泰基平原地区,基于LiDAR DEM制作了阴影图,将半透明显示的阴影图叠加到彩色渲染过的LiDAR DEM上,结合坡度图和等高线图识别错断水系、陡坎等的准确位置,并解译出122条断层.断层陡坎记录着断层的垂直位移量,为了定量地研究断层,在平行于断层走向的断层两侧及垂直于断层走向横穿断层,以200 m为间隔共抽取了1000多条剖面线,测得断层的垂直错动量.研究发现,朗伊泰基平原上各断层的滑动速率差异较大,通过计算每个断层的最大错动量与长度的比值(D/L),发现大多数的断层带D/L值都比Wells等(1994)得到的正断层的经验值高,说明这些地区发生了多次地震.Begg等基于LiDAR DEM提取的断层数量比前人研究识别得多,且对断层的位错量、滑动速率等都有了新的认识.Brunori等(2013)基于1 m分辨率的LiDAR DEM,对意大利亚平宁山脉Pettino断层的4个90~280 m的陡坎的高度、长度、坡度和坡向等特征进行了研究,通过阴影图、坡度图和坡向图中地形和坡度的突然变化来辨认陡坎的上下界限,同时,利用1 m分辨率的IKONOS全色影像和0.6 m分辨率的QuickBird影像来区别断层陡坎与人造物,最后精确提取了陡坎的相对高度、坡度、坡向等信息,制作了陡坎的3D示图,结合年代数据,估算了断层的滑动速率. ...
Detection of subtle tectonic-geomorphic features in densely forested mountains by very high-resolution airborne LiDAR survey
1
2013
... 在利用DEM的活动断层提取的研究中,由于常见DEM分辨率常低于30 m,无法识别小尺度的地表变形变位特征和精确的断层位置分布,而微小的地表变形变位是断层最新活动的证据,精确度不足的断层位置及其地表形变特征信息,会引起对断层位置分布、断层长度、断层活动强度及未来地震强度等的错误判断.近年来,机载激光雷达(Light Detection and Ranging,LiDAR) DEM等高分辨率DEM的出现,为解决这一问题提供了强有力的数据支持.如何深入利用高分辨率DEM数据,成为目前活动断层研究进一步发展所面临的挑战和机遇(Haugerud et al, 2003; Cunningham et al, 2006; Arrowsmith et al, 2009; Wechsler et al, 2009; Zielke, 2010; Cowgill et al, 2012; Grebby et al, 2012; Oskin et al, 2012; Lin et al, 2013; 刘静等, 2013; Nissen, 2014; Tarolli, 2014). ...
Derivation of groundwater flow-paths based on semi-automatic extraction of lineaments from remote sensing data
0
2011
Lineament mapping using multispectral remote sensing satellite data
1
2010
... 野外调查结合地势图、地质图等进行综合分析,是研究断层最传统、也是最经典的方法,该方法的局限是调查周期长,工作量大,一些偏远地区难以到达.随着遥感影像的出现及其分辨率的不断提高,基于遥感影像解译断层位置受到学者的关注(Koike et al, 1995; Novak et al, 2000; Marghany et al, 2010),但是遥感影像的解译通常难以定量地获取垂直方向的断层地表变形变位数据.数字高程模型(DEM)是对地表形态特征的模拟和数字化表达,同时具有平面和高度位置信息,可有效应用于构造地貌的定量化研究,在断层的研究中受到很大的瞩目. ...
a. Auto-detection and integration of tectonically significant lineaments from SRTM DEM and remotely-sensed geophysical data
0
2011
b. Morphotectonics inferred from the analysis of topographic lineaments auto-detected from DEMs: application and validation for the Sinai Peninsula, Egypt
0
2011
Active tectonics and the LiDAR revolution
1
2013
... 高分辨率DEM的出现,为解决这一问题提供了良好的数据支持.目前高分辨率DEM除了航空及地面激光雷达数据(LiDAR DEM),还有基于高分辨率遥感立体像对的DEM、以及近年出现的基于摄影测量的SfM(Structure from Motion)DEM等.目前主流的机载LiDAR DEM的精度已经达到分米级,能识别几十厘米以下的陡坎、微小的位错水系等微小断层地貌;同时LiDAR测量技术具有很强的穿透性,能穿过植被直接获取地面信息,提取植被覆盖下的地表形态.因此,当前的活动断层研究应用这些高分辨DEM,沿断层走向逐个详细识别地表形变特征,在此基础之上实现详细的断层位置分布的提取(Zachariasen et al, 2008; Meigs, 2013; Roering, 2013). ...
Coseismic fault zone deformation revealed with differential LiDAR: examples from Japanese Mw~7 intraplate earthquakes
1
2014
... 在利用DEM的活动断层提取的研究中,由于常见DEM分辨率常低于30 m,无法识别小尺度的地表变形变位特征和精确的断层位置分布,而微小的地表变形变位是断层最新活动的证据,精确度不足的断层位置及其地表形变特征信息,会引起对断层位置分布、断层长度、断层活动强度及未来地震强度等的错误判断.近年来,机载激光雷达(Light Detection and Ranging,LiDAR) DEM等高分辨率DEM的出现,为解决这一问题提供了强有力的数据支持.如何深入利用高分辨率DEM数据,成为目前活动断层研究进一步发展所面临的挑战和机遇(Haugerud et al, 2003; Cunningham et al, 2006; Arrowsmith et al, 2009; Wechsler et al, 2009; Zielke, 2010; Cowgill et al, 2012; Grebby et al, 2012; Oskin et al, 2012; Lin et al, 2013; 刘静等, 2013; Nissen, 2014; Tarolli, 2014). ...
Identifying geomorphic features using LANDSAT-5/TM data processing techniques on Lesvos, Greece
1
2000
... 野外调查结合地势图、地质图等进行综合分析,是研究断层最传统、也是最经典的方法,该方法的局限是调查周期长,工作量大,一些偏远地区难以到达.随着遥感影像的出现及其分辨率的不断提高,基于遥感影像解译断层位置受到学者的关注(Koike et al, 1995; Novak et al, 2000; Marghany et al, 2010),但是遥感影像的解译通常难以定量地获取垂直方向的断层地表变形变位数据.数字高程模型(DEM)是对地表形态特征的模拟和数字化表达,同时具有平面和高度位置信息,可有效应用于构造地貌的定量化研究,在断层的研究中受到很大的瞩目. ...
Detection of lineaments using airborne laser scanning technology: laxemar-simpevarp, Sweden
0
2007
Identification of an active fault in the Japanese Alps from DEM-based hill shading
0
2003
Near-field deformation from the El Mayor-Cucapah earthquake revealed by differential LiDAR
2
2012
... 在利用DEM的活动断层提取的研究中,由于常见DEM分辨率常低于30 m,无法识别小尺度的地表变形变位特征和精确的断层位置分布,而微小的地表变形变位是断层最新活动的证据,精确度不足的断层位置及其地表形变特征信息,会引起对断层位置分布、断层长度、断层活动强度及未来地震强度等的错误判断.近年来,机载激光雷达(Light Detection and Ranging,LiDAR) DEM等高分辨率DEM的出现,为解决这一问题提供了强有力的数据支持.如何深入利用高分辨率DEM数据,成为目前活动断层研究进一步发展所面临的挑战和机遇(Haugerud et al, 2003; Cunningham et al, 2006; Arrowsmith et al, 2009; Wechsler et al, 2009; Zielke, 2010; Cowgill et al, 2012; Grebby et al, 2012; Oskin et al, 2012; Lin et al, 2013; 刘静等, 2013; Nissen, 2014; Tarolli, 2014). ...
... 差分LiDAR技术能够定量获取地震变形的三维空间信息(Oskin et al, 2012; Glennie et al, 2014).Nissen等(2014)利用差分LiDAR技术测量了日本两个地震的断层带变形,地震带均被植被覆盖,研究利用震前2 m分辨率和震后1 m分辨率的LiDAR DEM,基于ICP(Iterative Closest Point)算法抽取了地震造成的三维位移量和旋转量,结果证明在其他遥感技术很难恢复变形位移的近地面和密集植被覆盖区域,差分LiDAR DEM能够较好地认识断层的滑动变形.Johnson等(2014)首次在植被稀少和矮小的华盛顿街和戈尔韦湖路两个区域将SfM技术应用于断层地形的研究中,使用ICP算法进行差分运算,同时将SfM获取的点云数据分别与机载LiDAR数据和地面LiDAR数据进行对比,指出SfM技术与一些简单的差分算法结合将成为测量和监测断层详细变形和滑坡、断层陡坎退化及裂点后退等地形变化有力的工具. ...
Faceted spurs at normal fault scarps: insights from numerical modeling
0
2009
Height of faceted spurs, a proxy for determining long-term throw rates on normal faults: evidence from the North Baikal Rift System, Siberia
0
2009
'You are here': connecting the dots with airborne LiDAR for geomorphic fieldwork
1
2013
... 高分辨率DEM的出现,为解决这一问题提供了良好的数据支持.目前高分辨率DEM除了航空及地面激光雷达数据(LiDAR DEM),还有基于高分辨率遥感立体像对的DEM、以及近年出现的基于摄影测量的SfM(Structure from Motion)DEM等.目前主流的机载LiDAR DEM的精度已经达到分米级,能识别几十厘米以下的陡坎、微小的位错水系等微小断层地貌;同时LiDAR测量技术具有很强的穿透性,能穿过植被直接获取地面信息,提取植被覆盖下的地表形态.因此,当前的活动断层研究应用这些高分辨DEM,沿断层走向逐个详细识别地表形变特征,在此基础之上实现详细的断层位置分布的提取(Zachariasen et al, 2008; Meigs, 2013; Roering, 2013). ...
Lineaments extraction and analysis in Eljufra area, Libya
0
2008
Integrated remote sensing data utilization for investigating structural and tectonic history of the Ghadames Basin, Libya
0
2011
LiDAR and field observations of slip distribution for the most recent surface ruptures along the central San Jacinto Fault
Application of terrain analysis to the mapping and spatial pattern analysis of subsurface geological fractures of Kuala Lumpur limestone bedrock, Malaysia
1
2012
... 除了以上两种常见的基于DEM提取断层位置的方法外,还可结合遥感影像等进行综合分析来判别断层.遥感影像的获取建立在一定光学参数的基础上且只能定量获取二维信息,而DEM能定量地反映地表的高程信息且在建立阴影图时可以人为模拟任意光照角度,由此弥补了遥感影像的不足之处.遥感影像分辨率较高以及影像中地物颜色、纹理的准确辨认可以弥补较低分辨率DEM的不足,有助于地物的直观识别.因此,通过高分辨率遥感影像与较低分辨率DEM的结合 (Chorowicz et al, 1999; Samy et al, 2012),可以进行地形三维叠加,从而更准确地从多角度对构造信息进行提取.在利比亚西北部的Eljufra地区,Saadi等(2008)对遥感影像进行了影像增强,基于影像的色调、纹理、河网形态等对研究区的线性构造进行了解译,然后将遥感影像叠加到DEM阴影图上进行三维模拟,解译出沿NNW-SSE和NNE-SSW两个方向的线性构造,其中沿NNE-SSW走向的线性构造首次被识别.同时基于重力数据提取出地表下的构造线,将其与地质图解译的已有的构造线对比,发现地表和地下的构造相对比较吻合.Saadi等(2011)在上述研究的基础上基于DEM提取水系,通过识别直线状沟谷、线状凹陷及坡度大的陡坎等确定线性构造位置,还通过已有地质图和野外观察解译了地质构造线,将其与遥感数据解译的构造线综合,对古达米斯(Ghadames)流域的起源和演化进行了定量研究,重新认识了古达米斯流域及其接壤的利比亚西北部其他地区的构造形态.Saadi等(2008, 2011)注重多源数据结合,全面地解译了断层的构造信息.地质图上的断层信息,受比例尺和获取方法不同的影响,与DEM和遥感影像所反映的线性构造信息有一定的位置差异,但其对提取的断层具有很好的验证和指导作用. ...
Holocene fault scarps near Tacoma, Washington, USA
1
2004
... 断层陡坎是断层活动形成的典型的地表变形变位之一,记录着一次或多次断层活动的垂直位错量.结合陡坎的形变特征和陡坎的年代数据,可以用来求取断层的平均活动速率,研究断层的活动强度和结构特征(Hooper et al, 2003; Sherrod et al, 2004; Chan et al, 2007; Kondo et al, 2008; Petit, Gunnell, et al, 2009; Petit, Meyer, et al, 2009; Ganev et al, 2010; Hilley et al, 2010; Wiatr et al, 2013).Begg等(2010)在新西兰陶坡裂谷扩张最快的朗伊泰基平原地区,基于LiDAR DEM制作了阴影图,将半透明显示的阴影图叠加到彩色渲染过的LiDAR DEM上,结合坡度图和等高线图识别错断水系、陡坎等的准确位置,并解译出122条断层.断层陡坎记录着断层的垂直位移量,为了定量地研究断层,在平行于断层走向的断层两侧及垂直于断层走向横穿断层,以200 m为间隔共抽取了1000多条剖面线,测得断层的垂直错动量.研究发现,朗伊泰基平原上各断层的滑动速率差异较大,通过计算每个断层的最大错动量与长度的比值(D/L),发现大多数的断层带D/L值都比Wells等(1994)得到的正断层的经验值高,说明这些地区发生了多次地震.Begg等基于LiDAR DEM提取的断层数量比前人研究识别得多,且对断层的位错量、滑动速率等都有了新的认识.Brunori等(2013)基于1 m分辨率的LiDAR DEM,对意大利亚平宁山脉Pettino断层的4个90~280 m的陡坎的高度、长度、坡度和坡向等特征进行了研究,通过阴影图、坡度图和坡向图中地形和坡度的突然变化来辨认陡坎的上下界限,同时,利用1 m分辨率的IKONOS全色影像和0.6 m分辨率的QuickBird影像来区别断层陡坎与人造物,最后精确提取了陡坎的相对高度、坡度、坡向等信息,制作了陡坎的3D示图,结合年代数据,估算了断层的滑动速率. ...
Neotectonic development of drainage networks in the East Sudeten Mountains and monitoring of recent fault displacements (Czech Republic)
1
2008
... 水系形态对流域内断层活动的响应极为敏感,因此水系形态分析也是断层构造解译的重要技术手段.根据不同水系在同一直线上展布、主河流两侧的水系密度差异、河流系统拐弯且呈直角等水系特征可以解译断层(Jackson et al, 1996; Chorowicz et al, 1998; Dumont et al, 2005; Guarnieri et al, 2008; Štěpančíková et al, 2008; Walker et al, 2012). ...
High-resolution topography for understanding Earth surface processes: opportunities and challenges
1
2014
... 在利用DEM的活动断层提取的研究中,由于常见DEM分辨率常低于30 m,无法识别小尺度的地表变形变位特征和精确的断层位置分布,而微小的地表变形变位是断层最新活动的证据,精确度不足的断层位置及其地表形变特征信息,会引起对断层位置分布、断层长度、断层活动强度及未来地震强度等的错误判断.近年来,机载激光雷达(Light Detection and Ranging,LiDAR) DEM等高分辨率DEM的出现,为解决这一问题提供了强有力的数据支持.如何深入利用高分辨率DEM数据,成为目前活动断层研究进一步发展所面临的挑战和机遇(Haugerud et al, 2003; Cunningham et al, 2006; Arrowsmith et al, 2009; Wechsler et al, 2009; Zielke, 2010; Cowgill et al, 2012; Grebby et al, 2012; Oskin et al, 2012; Lin et al, 2013; 刘静等, 2013; Nissen, 2014; Tarolli, 2014). ...
Offset rivers, drainage spacing and the record of strike-slip faulting: The Kuh Banan Fault, Iran
1
2012
... 水系形态对流域内断层活动的响应极为敏感,因此水系形态分析也是断层构造解译的重要技术手段.根据不同水系在同一直线上展布、主河流两侧的水系密度差异、河流系统拐弯且呈直角等水系特征可以解译断层(Jackson et al, 1996; Chorowicz et al, 1998; Dumont et al, 2005; Guarnieri et al, 2008; Štěpančíková et al, 2008; Walker et al, 2012). ...
Application of high resolution DEM data to detect rock damage from geomorphic signals along the central San Jacinto Fault
1
2009
... 在利用DEM的活动断层提取的研究中,由于常见DEM分辨率常低于30 m,无法识别小尺度的地表变形变位特征和精确的断层位置分布,而微小的地表变形变位是断层最新活动的证据,精确度不足的断层位置及其地表形变特征信息,会引起对断层位置分布、断层长度、断层活动强度及未来地震强度等的错误判断.近年来,机载激光雷达(Light Detection and Ranging,LiDAR) DEM等高分辨率DEM的出现,为解决这一问题提供了强有力的数据支持.如何深入利用高分辨率DEM数据,成为目前活动断层研究进一步发展所面临的挑战和机遇(Haugerud et al, 2003; Cunningham et al, 2006; Arrowsmith et al, 2009; Wechsler et al, 2009; Zielke, 2010; Cowgill et al, 2012; Grebby et al, 2012; Oskin et al, 2012; Lin et al, 2013; 刘静等, 2013; Nissen, 2014; Tarolli, 2014). ...
Evaluating knickpoint recession along an active fault for paleoseismological analysis: The Huoshan Piedmont, Eastern China
1
2015
... 河流能够地形能够较好地记录断层活动,不同规模水系的位错特征是活动断层研究的重要参数,国内外的学者对此开展了大量的研究,取得了令人瞩目的成果(Hayakawa et al, 2006; Zielke, 2010; Ludwig et al, 2012; Wei et al, 2015). ...
New empirical relationships among magnitude, rupture length, rupture width, rupture area, and surface displacement
0
1994
Slip vector analysis with high resolution t-LiDAR scanning
1
2013
... 断层陡坎是断层活动形成的典型的地表变形变位之一,记录着一次或多次断层活动的垂直位错量.结合陡坎的形变特征和陡坎的年代数据,可以用来求取断层的平均活动速率,研究断层的活动强度和结构特征(Hooper et al, 2003; Sherrod et al, 2004; Chan et al, 2007; Kondo et al, 2008; Petit, Gunnell, et al, 2009; Petit, Meyer, et al, 2009; Ganev et al, 2010; Hilley et al, 2010; Wiatr et al, 2013).Begg等(2010)在新西兰陶坡裂谷扩张最快的朗伊泰基平原地区,基于LiDAR DEM制作了阴影图,将半透明显示的阴影图叠加到彩色渲染过的LiDAR DEM上,结合坡度图和等高线图识别错断水系、陡坎等的准确位置,并解译出122条断层.断层陡坎记录着断层的垂直位移量,为了定量地研究断层,在平行于断层走向的断层两侧及垂直于断层走向横穿断层,以200 m为间隔共抽取了1000多条剖面线,测得断层的垂直错动量.研究发现,朗伊泰基平原上各断层的滑动速率差异较大,通过计算每个断层的最大错动量与长度的比值(D/L),发现大多数的断层带D/L值都比Wells等(1994)得到的正断层的经验值高,说明这些地区发生了多次地震.Begg等基于LiDAR DEM提取的断层数量比前人研究识别得多,且对断层的位错量、滑动速率等都有了新的认识.Brunori等(2013)基于1 m分辨率的LiDAR DEM,对意大利亚平宁山脉Pettino断层的4个90~280 m的陡坎的高度、长度、坡度和坡向等特征进行了研究,通过阴影图、坡度图和坡向图中地形和坡度的突然变化来辨认陡坎的上下界限,同时,利用1 m分辨率的IKONOS全色影像和0.6 m分辨率的QuickBird影像来区别断层陡坎与人造物,最后精确提取了陡坎的相对高度、坡度、坡向等信息,制作了陡坎的3D示图,结合年代数据,估算了断层的滑动速率. ...
Detailed mapping of the Northern San Andreas Fault using LiDAR imagery
1
2008
... 高分辨率DEM的出现,为解决这一问题提供了良好的数据支持.目前高分辨率DEM除了航空及地面激光雷达数据(LiDAR DEM),还有基于高分辨率遥感立体像对的DEM、以及近年出现的基于摄影测量的SfM(Structure from Motion)DEM等.目前主流的机载LiDAR DEM的精度已经达到分米级,能识别几十厘米以下的陡坎、微小的位错水系等微小断层地貌;同时LiDAR测量技术具有很强的穿透性,能穿过植被直接获取地面信息,提取植被覆盖下的地表形态.因此,当前的活动断层研究应用这些高分辨DEM,沿断层走向逐个详细识别地表形变特征,在此基础之上实现详细的断层位置分布的提取(Zachariasen et al, 2008; Meigs, 2013; Roering, 2013). ...
Slip in the 1857 and earlier large earthquakes along the Carrizo Plain, San Andreas Fault
3
2010
... 在利用DEM的活动断层提取的研究中,由于常见DEM分辨率常低于30 m,无法识别小尺度的地表变形变位特征和精确的断层位置分布,而微小的地表变形变位是断层最新活动的证据,精确度不足的断层位置及其地表形变特征信息,会引起对断层位置分布、断层长度、断层活动强度及未来地震强度等的错误判断.近年来,机载激光雷达(Light Detection and Ranging,LiDAR) DEM等高分辨率DEM的出现,为解决这一问题提供了强有力的数据支持.如何深入利用高分辨率DEM数据,成为目前活动断层研究进一步发展所面临的挑战和机遇(Haugerud et al, 2003; Cunningham et al, 2006; Arrowsmith et al, 2009; Wechsler et al, 2009; Zielke, 2010; Cowgill et al, 2012; Grebby et al, 2012; Oskin et al, 2012; Lin et al, 2013; 刘静等, 2013; Nissen, 2014; Tarolli, 2014). ...
... 河流能够地形能够较好地记录断层活动,不同规模水系的位错特征是活动断层研究的重要参数,国内外的学者对此开展了大量的研究,取得了令人瞩目的成果(Hayakawa et al, 2006; Zielke, 2010; Ludwig et al, 2012; Wei et al, 2015). ...

