董南 , 杨小唤, 蔡红艳
DONG Nan, YANG Xiaohuan, CAI Hongyan
通讯作者:
收稿日期: 2016-11-14
修回日期: 2017-07-24
网络出版日期: 2017-12-25
版权声明: 2017 《地理学报》编辑部 本文是开放获取期刊文献,在以下情况下可以自由使用:学术研究、学术交流、科研教学等,但不允许用于商业目的.
基金资助:
作者简介:
作者简介:董南(1984-), 男, 河北唐山人, 博士, 注册测绘师, 主要从事人口地理、智慧城市、遥感与GIS应用研究。E-mail: dongnan67@126.com
展开
摘要
人口密度格网尺度适宜性研究旨在遴选适宜格网,较好表达人口分布位置,揭示人口分布差异,提高人口数据空间化质量。以安徽省宣州区的乡村区域为研究区,设计了人口密度格网尺度适宜性评价方法,通过构建位置表达度、数值信息表达度和空间关系表达度三类评价指标,开展了人口密度格网尺度适宜性评价研究,结合格网尺度—指标数值关系曲线,确定人口密度适宜格网尺度遴选方案,选取适宜格网尺度,评价了人口密度适宜格网的尺度合理性。结果表明:兼顾位置、数值精度、空间关系三方面的表达度,40 m、50 m格网是一个相对适宜的格网尺度,是生产高质量人口空间数据的适宜格网。初步研究表明,针对本研究区的人口密度格网尺度适宜性评价方案是合理的、有效的,是生产高质量人口空间数据遴选适宜格网的有效方法。
关键词:
Abstract
Grid cell is the basic unit to express population distribution based on gridded population data. The choice of suitable grid size is very important, as the resolution must be fine enough to capture the desired spatial variation of population within the area of interest. The research on grid size suitability refers to determinate an appropriate grid size for revealing the population distribution difference and the distribution position for human beings in geographical space. It is important to provide improvement in accuracies of gridded population distribution. However, currently little research has been done in this area. Many well-modeled gridded population dataset are basically built at a single grid scale. If the grid cell size is not appropriate, it will result in spatial information loss or data redundancy. Besides, there is scale dependency in the spatial distribution of population. And the characteristics of population distribution patterns are different at varied grid scales. This study designed a scheme on grid size suitability evaluation method. The rural area of Xuanzhou District in Anhui Province was selected as the study area. The research on grid size suitability was carried out by constructing three kinds of expressed levels, which included location expressed level, numeric information expressed level and spatial relationship expressed level. The scheme on choosing suitable grid size was determined in combination of grid size-indicator value curves. Then the suitable grid size was selected and its rationality was evaluated. Results reveal that comsidering three expressions of location, numeric information and spatial relationship, 40 m and 50 m grids are relatively suitable grid size, which can be recommended as the appropriate scale for generating a high-quality gridded population distribution in the study area. Based on the preliminary study, result also indicates that it is reasonable and effective to assess grid size suitability by the evaluation method in three perspectives of expressed level. It is expected that the method on grid size suitability can make contributions to the advancement of accurate gridded population mapping.
Keywords:
格网单元是表达人口分布信息的基本载体。如何选取一个适宜大小的格网,更好表达人口分布空间特征,是提高人口空间数据集质量的重要方面。人口空间数据格网尺度适宜性研究旨在确定适宜格网大小,较好表达人口分布位置,揭示人口分布差异。
人口数据空间化将表达人口信息的空间单元由行政区划单元转换为规则格网单元。如果格网单元大于行政区划单元,则人口数据空间化会导致人口信息丢失;如果格网单元小于能够表达人口分布特征的面单元,则人口数据空间化会导致数据冗余[1]。研究表明:人口空间分布具有显著的空间自相关性和尺度依赖性[2-4],不同尺度格网所刻画的人口分布空间格局具有不同的特征[5-6]。在进行人口数据空间化研究时,多大格网是适宜的?这需要一种评价方法作为选择依据。因此,进行格网尺度适宜性评价方法研究,分析不同格网尺度的人口分布特征,确定适宜格网尺度,具有重要的研究意义。
格网人口空间数据易于开展空间分析,易于同格网化其他地理要素空间数据相融合,故得到广泛应用[7]。如全球或洲尺度格网化人口空间数据集:GPW(Gridded Population of the World, 5 km)[8]、LandScan(1 km)[9]、GRUMP(Global Rural-Urban Mapping Project, 1 km)[10]、UNEP/GRID(Global Resource Information Database, 5 km)[11]、The WorldPop Project(100 m)[12-13],此外,部分学者构建了一些国家级的格网人口数据集,如东南亚(100 m)[14]、中国(1 km)[15],或区域级的格网人口数据集,如阿拉楚阿县(Alachua County, 30 m)[16]、攀枝花市东区(50 m)[17]。这些单一格网的人口空间数据集均未讨论其所选用的格网大小是否适宜。其实,人口空间数据库的精度不但与建模方法、源数据分辨率、人口普查精度有关[12, 18],而且与选用的格网大小也有关[3]。因此,深入研究人口空间数据集的格网尺度适宜性,有利于提高人口空间数据集的表达精度。
格网尺度适宜性研究广泛存在于地学领域。如选取遥感影像及其衍生产品的最优分辨率[19-21],确定DEM适宜分辨率[22-24],然而关注人口空间数据集的格网尺度适宜性的研究较少。目前,确定适宜格网大小主要有两类方法。① 基于数据源的适宜格网确定方法:土地利用数据的精度损失分析法[25],街道平均面积百分比法[26],遥感数据源与格网尺度的响应关系法[3],最小居民地面积确定法[27];此类方法用于人口空间化建模之前,通过分析源数据来确定适宜格网。优点是思路简单,便于实现,缺点是只对源数据进行分析,缺乏对人口空间信息的适宜性分析。② 基于人口空间化结果表达度的方法:统计学法、空间自相关法、景观指数法和半方差函数法[4-5, 28]。此类方法能综合探讨源数据及人口空间数据隐含的尺度特征,结果具有说服力,但需要以多格网尺度人口空间数据为前提。探讨如何选取合理、有效的指标来评价格网尺度适宜性具有重要意义。
本文将人口空间数据的格网尺度适宜性研究归纳为位置表达度、数值信息表达度及空间关系表达度[29]。通过构建格网尺度—指标数值之间的曲线及适宜格网尺度确定方案,选取适宜格网尺度。从数值精度分析角度,评价了适宜格网尺度的合理性。旨在提出一个人口空间数据格网尺度适宜性研究的评价方案,为人口数据空间化研究选择适宜格网尺度提供技术服务,进一步提高人口数据空间化质量。
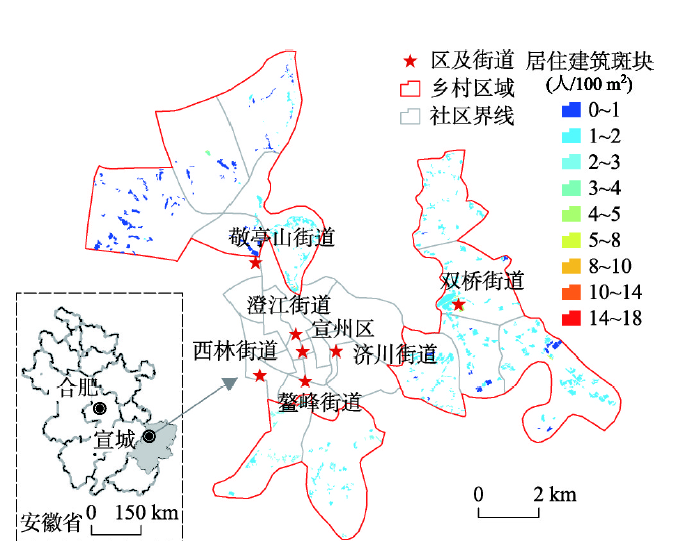
宣州市区位于安徽省东南部,包括双桥、鳌峰、西林、澄江、济川、敬亭山6个街道,包括29个社区(村)。人口密度的高低是城市与乡村的重要区别之一,故以人口密度指标作为划分城乡的定量标准,将人口密度低于1500人/km2的社区(村)作为乡村区域[30],确定12个社区(村)为乡村区域研究区,总面积约70 km2(图1)。截止2015年,研究区常住人口约3.4万,12个社区(村)的人口密度范围为137~989人/km2。
图1 研究区地理位置示意及居住建筑尺度的人口空间分布
Fig. 1 Geographical location of the study area and population distribution at residential building scale
研究区人口空间分布矢量数据来源于中国科学院资源环境科学数据中心。该数据基于居住空间属性的人口空间化方案而生成,获取了每个居住建筑斑块的人口密度值,展示了建筑物尺度上人口的空间分布情况[31]。空间化方案为:以居住建筑斑块面积、斑块内建筑面积比重、建筑物层数、公摊率等居住空间属性为人口分布数量的指示因子,以居住建筑的轮廓斑块为人口分布位置的指示因子,利用街道界线和街道常住人口数据为控制单元,建立人口空间化线性模型。
居住建筑斑块,是指对Quick Bird遥感影像进行目视解译,通过矢量化方法提取居住建筑物的轮廓多边形。乡村的居住建筑遵循“一户一宅”的原则,具有排列无序、大小不一及人口密度低等特点,因此在乡村区域,将邻近建筑物间距小于10 m的建筑物群作为整体,进行矢量化生成不规则多边形,本文称之为住宅用地斑块,住宅用地斑块是多个距离小于10 m的居住建筑斑块的集合(图2a中的斑块A1、A2)。
图2 不同格网尺度下住宅用地斑块和人口栅格斑块的位置表达
Fig. 2 Location expression of residential land patch and population raster patch on different grid sizes
格网尺度适宜性研究需要以多格网尺度人口空间数据为前提。依据研究区的人口空间分布矢量数据可知,住宅用地斑块中,小斑块的数量比重约为13%,其最短边长度为8~13 m,大斑块的平均宽度为200 m。因此,确定多格网尺度为5 m、10 m、20 m、…、190 m和200 m。采用ArcGIS工具“Create Fishnet”构建覆盖整个研究区的不同格网尺度的渔网格,应用公式(1)计算得到每个格网的人数。最后,采用ArcGIS软件中工具“Polygon to Raster”生产多格网尺度的人口空间数据。
式中:Pij为格网单元(i, j)的人数;n为与格网单元(i, j)相交的住宅用地斑块的个数;Dh为第h个住宅用地斑块的人口密度;Sh为第h个住宅用地斑块与栅格单元(i, j)相交部分的面积。
人口空间数据格网尺度适宜性研究,所选取的适宜格网尺度不仅能较好揭示人口分布差异,还能较准确地表达人口分布位置。结合已有研究和格网尺度适宜性内涵,本文阐述了5个指标的选取原因,从位置表达度、数值信息表达度及空间关系表达度三方面分析格网尺度适宜性。
位置表达度是指人口空间数据表达研究区内人口分布位置的准确程度。较好的位置表达度是指在某特定格网尺度下,人口空间数据能较准确地揭示人口分布的真实位置,该特定格网即为适宜格网尺度。
人口栅格斑块是分析位置表达度的基本单元。人口空间数据上,由邻接的、栅格值大于0(有人区)的栅格像元组成的区域转换生成的不规则多边形,将其定义为人口栅格斑块(图2b中的斑块B1、B2)。因此,人口栅格斑块可以表征人口的分布位置范围。本文用住宅用地斑块(图2a中的斑块A1、A2)表征人口的真实分布位置范围。可知人口栅格斑块的形状,与对应的住宅用地斑块的形状越一致或相似,位置表达度越好。
本文选取一致性量测指标(Consistency measure, CM)和形状指数比指标(Shape index rate, SIR)来描述人口栅格斑块与住宅用地斑块的一致性或相似度。CM和SIR值越大,一致性或相似度越大,人口空间数据表达的人口分布位置越接近实际,位置表达度就越好。
3.1.1 一致性量测指标(CM) 人口栅格斑块和住宅用地斑块的一致性用CM[32]来描述:
式中:CMk为不同格网尺度k(k = 5, 10, 20, …, 200 m)下的一致性量测指标值;Apk为格网尺度k下,人口栅格斑块的总面积;AR为格网尺度k下,住宅用地斑块的总面积;
3.1.2 形状指数比(SIR) 形状指数是景观生态学中评价斑块及景观空间格局尺度依赖性的定量指标,也是形状复杂度最简单、最直接的量度[33]。人口栅格斑块和住宅用地斑块的相似性用形状指数比(SIR)来描述:
式中:SIRk为不同格网尺度k(k = 5, 10, 20,
以两个真实的住宅用地(图2a)为例进行说明,提取生成两个住宅用地斑块(A1和A2)。图2b~2d展示了三个代表性的人口空间数据。采用公式(2)~(3),可以计算得到不同格网尺度下的CM和SIR值。
当格网大小为k = 40 m时,依旧有两个人口栅格斑块(B1和B2)来展示人口分布位置。B1和B2的空间位置和形状与A1和A2最相似,CM和SIR值也是最大的。与图2c和2d相比,40 m格网的人口空间数据,其人口分布位置表达效果令人满意。当格网大小k = 200 m时,只有一个人口栅格斑块来展示人口分布位置,并且该斑块形状与A1和A2的形状极不相似。因栅格像元较大,使得人口分布位置变得粗化和不准确,导致人口分布位置向非居住用地扩展。图2d中栅格像元C、D和E表明:部分人居住在河滩及水域上;栅格像元F和G表明:部分人居住在非住宅用地上,这与现实情况不符,因此产生了位置表达错误。与图2b和2c相比,图2d位置表达错误最大,CM和SIR值最小。图2c中格网大小k = 100 m的人口栅格斑块是图2b和图2d的过渡情况。总的来说,图2表明:随着格网单元的变大,人口栅格斑块的形状趋于简单和规则化,位置表达错误越来越大,和实际情况越来越不一致。因此,可以选用一致性量测指标(CM)及形状指数比(SIR)来分析位置表达度。
数值信息表达度是指人口空间数据表达研究区全域范围内人口密度值的差异程度。较好的数值信息表达度是指在某特定格网尺度下,人口空间数据能较准确地揭示研究区全域范围内人口密度值的差异程度,该特定格网即为适宜格网尺度。
用规则格网单元作为人口空间分布的载体,其缺点是:格网单元内部的人口分布差异被掩盖。当用一个足够大的格网去表达一个镇时,该镇内部的人口密度差异不能体现;相反,用很多小的格网去表达该镇时,会有多个不同人口密度的栅格像元来揭示该镇内部的人口分布差异。可知某区域人口密度值差异越大,数值信息表达度越好。
本文选取人口密度标准差(Standard deviation of population density, SDPD)和斑块多样性指标(Patch diversity index, PDI)来描述人口密度值差异。SDPD和PDI值越大,人口密度值差异度越大,表明人口分布差异越大,数值信息表达度越好。
3.2.1 人口密度标准差(SDPD) 标准差是统计学中的重要指标,它能描述一个数值序列的离散程度。将人口空间数据的像元值作为数值序列,用人口密度标准差指标来揭示不同格网尺度下人口密度值差异度。
3.2.2 斑块多样性指标(PDI) 景观多样性指数是景观生态学空间格局的基本分析指标,能揭示景观中斑块类型的多样性[34-35]。斑块多样性指标(PDI)就是以景观多样性指数为基础进行构建,来测度研究区内斑块类型的多样性,描述人口密度值差异度。
PDI的分析对象是类型数据。人口密度值不能直接表现为类型数据,但可以依据人口密度值的大小进行分组,并以组代替类型用于斑块多样性分析。对于人口空间数据,本文将所有像元值(人口密度值)>0的栅格像元按照1人/100 m2的阈值分成不同的组,每一组作为一种斑块类型[36]。再依据PDI公式(4)计算不同格网尺度人口空间数据的斑块多样性指标。斑块类型越多,人口密度值差异度越大,表明研究区人口分布差异越大。
式中:PDIk为不同格网尺度k(k = 5, 10, 20,…, 200m)下的斑块多样性指标值;m为不同类型斑块的个数;Rik为格网尺度k上,斑块类型i与所有斑块的面积比重。随着斑块类型的增加或各类型斑块所占面积比例趋于相似时,PDIk是变大的。即斑块类型越多,人口密度多样性越大。PDIk ≥ 0,无上限;当PDIk = 0,表明研究区内只有一种类型斑块。
空间关系表达度是指人口空间数据表达研究区局部区域人口分布差异的程度。较好的空间关系表达度是指在某特定格网尺度下,人口空间数据能较准确地揭示研究区局部区域的人口分布差异,该特定格网即为适宜格网尺度。
本文选取平均局部方差指标(the average local variance, ALV)来描述研究区局部区域人口分布差异的程度。指标值越大,局部人口分布差异越大。基于“类内局部方差较小,类间局部方差较大”的思想,Woodcock等提出了平均局部方差法来确定最优分辨 率[21]。即通过描述栅格像元之间的空间相关性,用平均局部方差法选取遥感影像的最佳分辨率[37]。从这个角度看,本文称之为“空间关系表达度”。平均局部方差法也被广泛用于确定DEM的适宜分辨率[23-24]。
局部方差是一个邻域内(如3×3窗口)所有像元值的方差。随格网单元的变大,局部方差值的变化主要呈现三种情况(图3):① 当格网单元很小时,真实世界中的某一个住宅用地斑块可以用多个较小的、人口密度值相同的格网单元来表征。这些格网单元属于同一类,空间自相关较高,因此局部方差值较小。此格网尺度下,人口空间数据表达的局部区域人口分布差异小;② 格网单元继续变大,当其大小接近要表达的住宅用地斑块大小时,相邻的格网单元大多数不再表达同一个斑块,这些格网单元属于不同类别,空间自相关较低,因此局部方差值较大。此格网尺度下,人口空间数据表达的局部区域人口分布差异变大;③ 当格网单元变的足够大时,一个格网单元内可能包含多个不同的住宅用地斑块,可以理解为该格网属于混合像元,相邻的混合像元的相似性变大,空间自相关变高,局部方差值变小。因此,选取ALV来描述研究区局部区域人口分布差异度,ALV值越大,局部区域的人口分布差异性越大,空间关系表达度越好。本文选择较为常用的3×3窗口来计算ALV值。
式中:ALV为研究区的平均局部方差值;LVij为格网单元(i, j)的局部方差值;N为所有格网单元的个数;n为3 × 3窗口内的格网单元个数(n = 9);Vm为窗口内第m个格网单元的人口密度值;
图3 应用在格网单元上的局部方差方法原理(参考[
Fig. 3 Rationale of the method of local variance (LV) as applied on raster cells
采用公式(2)~(3),计算得到不同格网尺度下CM和SIR值。用散点图的方式对CM和SIR值进行统计分析。曲线拟合分析表明CM和SIR值的下降趋势可以用幂函数曲线进行拟合,可决系数(R2)都超过0.95。随着格网单元的变大,CM和SIR值一开始快速降低,之后缓慢降低(图4,图5)。
图4 CM值及其相对变化率随格网单元增大的变化趋势
Fig. 4 The variation of CM and its relative change rate with the grid cell size increasing
图5 SIR值及其相对变化率随格网单元增大的变化趋势
Fig. 5 The variation of SIR and its relative change rate with the grid cell size increasing
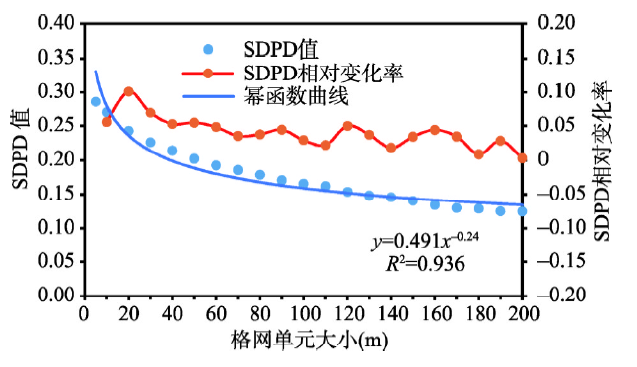
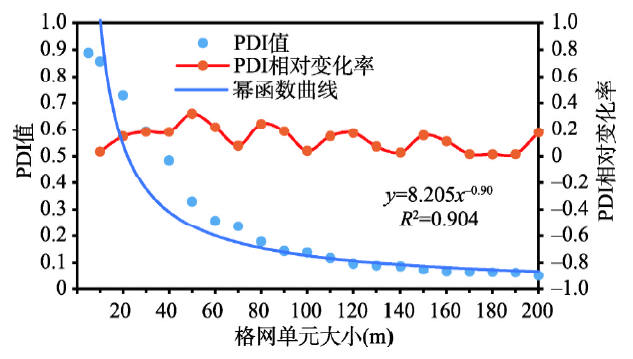
采用标准差公式和公式(4),计算得到不同格网尺度下SDPD和PDI值。用散点图的方式对SDPD和PDI值进行统计分析。曲线拟合分析表明SDPD和PDI值的下降趋势可以用幂函数曲线进行拟合,可决系数(R2)都超过0.90。随着格网单元的变大,SDPD和PDI值一开始快速降低,之后缓慢降低(图6,图7)。
图6 SDPD值及其相对变化率随格网单元增大的变化趋势
Fig. 6 The variation of SDPD and its relative change rate with the grid cell size increasing
图7 PDI值及其相对变化率随格网单元增大的变化趋势
Fig. 7 The variation of PDI and its relative change rate with the grid cell size increasing
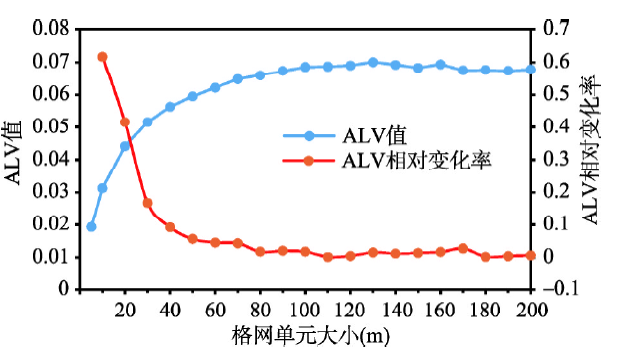
采用公式(5)~(6),计算得到不同格网尺度下ALV值。用散点图的方式对ALV值进行趋势变化分析。图8表明随着格网单元的变大,ALV值一开始快速增大,之后缓慢增大,最后趋于稳定。
图8 ALV值及其相对变化率随格网单元增大的变化趋势
Fig. 8 The variation of ALV and its relative change rate with the grid cell size increasing
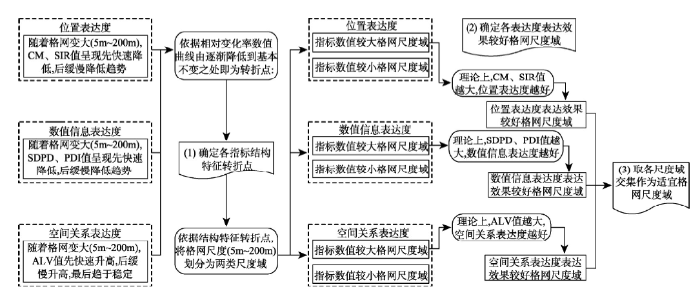
适宜格网尺度确定方案包括三步,流程图如图9所示。
(1)确定CM、SIR、SDPD、PDI和ALV指标结构特征转折点。数值相对变化率,即某格网单元所对应的指标值相对于前一个格网单元所对应的指标值的变化程度,该指标可以反应数值序列的变化程度[39]。依据公式(7)可以获得不同格网尺度k下各指标相对变化率的绝对值(Rk):
式中:Rk为不同格网尺度k(k = 5, 10, 20,…, 200 m)下对应的指标值相对于前一个格网尺度(previous∙k)的相对变化率(如R10 = (V10-V5)/V5);Vk为格网尺度k对应的某指标数值。因为没有小于5 m格网的指标数值(Vprevious∙5),故数值序列中没有R5。
4.1和4.2小节分析结果表明:随着格网单元的变大,CM、SIR、SDPD和PDI值均按照负指数幂函数曲线的变化趋势,先快速降低,后缓慢降低(图4~图7);4.3小节分析结果表明:随着格网单元的变大,ALV值先快速升高,后缓慢升高(图8)。各指标数值从快速变化到缓慢变化,明显存在转折点。在此转折点处,CM、SIR、SDPD、PDI和ALV指标结构特征体现出分异性,即转折点之前各指标结构特征变化较大,转折点之后各指标结构特征变化较小。依据此转折点,可以将格网尺度(5 m~200 m)划分为两类尺度域:① 指标数值较大格网尺度域;② 指标数值较小格网尺度域。本文依据数值相对变化率来确定结构特征转折点,相对变化率数值曲线由逐渐降低到基本不变之处即为转折点。
(2)确定位置表达度、数值信息表达度、空间关系表达度表达效果较好格网尺度域。依据各指标内涵,理论上CM、SIR、SDPD、PDI和ALV值越大,位置、数值信息、空间关系表达度越好。因此,将第一步确定各指标数值较大格网尺度域确定为表达效果较好尺度域。
(3)以三个表达度表达效果较好格网尺度域的交集作为适宜格网尺度域。格网尺度适宜性研究广泛存在于地学领域。如选取遥感影像及其衍生产品的最优分辨率[19-21],确定DEM适宜分辨率[22-24]。局部方差法,半方差函数法等为常用方法,其基本原则是所选取的分辨率能揭示研究对象的分布差异。与遥感影像、DEM等空间数据相比,人口空间数据有其独特特征,所选取的适宜格网尺度不仅能较好揭示人口分布差异,还应能较准确地表达人口分布位置。位置表达度强调人口分布位置的表达,数值信息表达度强调研究区全域范围内人口密度值差异的表达,空间关系表达度强调研究区局部区域人口分布差异的表达。因此,人口空间数据格网尺度适宜性研究需综合三个表达度的结果。本文以三个表达度确定的表达效果较好格网尺度域的交集作为适宜格网尺度域。
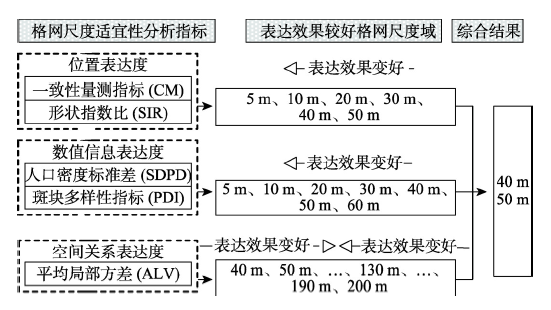
5.2.1 位置表达度,5~50 m为表达效果较好格网尺度域 对于CM指标,在60 m格网之前,其相对变化率数值较大,且变化较大,表明其结构特征变化较大;在60 m格网之后,其相对变化率数值较小,且变化较小,表明其结构特征变化较小;60 m格网为相对变化率数值曲线由逐渐降低到基本不变的转折点(图4)。综上,60 m格网为结构特征转折点。因为小于60 m格网的CM指标数值较大,表达度较好,所以确定5~50 m为表达效果较好格网尺度域。同理,对于SIR指标,70 m格网为结构特征转折点(图5),确定5 ~60 m为表达效果较好格网尺度域。最终确定二者交集5~50 m为位置表达度表达效果较好格网尺度域。理论上,格网单元越小,人口栅格斑块的形状特征与实际越一致,位置表达效果越好。
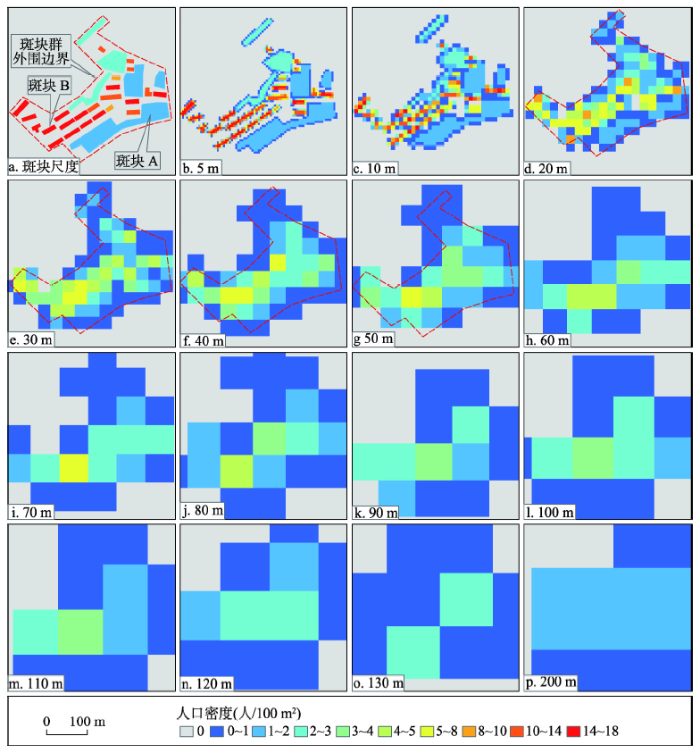
选取一个代表性区域(图10a)来说明位置表达的效果。代表性原因:① 该区域内有两种类型的住宅用地斑块:建筑物间距小于10 m的建筑物群构成的大斑块(如斑块A)和单个建筑构成的小斑块(如斑块B)。两种类型斑块基本上能代表整个研究区的斑块类型;② 该区域内人口密度值域为1~18人/100 m2,这与整个研究区的人口密度值域相同。
图10 不同格网单元的人口空间数据局部展示
Fig. 10 The partial map of population distribution raster data on different grid scales
图10展示了不同格网尺度下代表性区域的人口分布情况。当格网尺度为5 m、10 m时,人口栅格斑块形状轮廓最清晰,人口分布位置特征(图10b、10c)与真实情况(图10a)最一致,位置表达效果最好;当格网尺度为20~50 m时(图10d、10g),人口栅格斑块彼此连接构成一整体,一定程度上导致人口分布位置扩展到了非居住用地上,但是其代表的人口分布范围与真实分布范围(图10a斑块群外围边界)基本一致;从60 m格网开始,随着格网单元的变大,人口分布位置继续向非居住用地上扩展,位置表达效果较差。
5.2.2 数值信息表达度,5~60 m为表达效果较好格网尺度域 对于SDPD指标,在70 m格网之前,其相对变化率数值较大,且变化较大,表明其结构特征变化较大;在70 m格网之后,其相对变化率数值较小,且变化较小,表明其结构特征变化较小;70 m格网为相对变化率数值曲线由逐渐降低到基本不变的转折点(图6)。综上,70 m格网为结构特征转折点。对于PDI指标,虽然其相对变化率数值曲线波动性较大,但是70 m格网是该曲线由最大值降低到较小值的转折点(图7),同时鉴于70 m格网之后PDI指标数值较小,表达效果欠佳,最终确定70 m为结构特征转折点。因为小于70 m格网的SDPD和PDI指标数值较大,表达度较好,所以确定5~60 m为表达效果较好格网尺度域。理论上,格网单元越小,人口密度值差异度和多样性越大,研究区全域人口分布差异的表达效果越好。
图10展示了不同格网尺度下代表性区域的人口分布情况。当格网尺度为5 m、10 m时,人口分布差异(图10b、10c)与真实情况(图10a)最相似,不同人口密度值的空间位置与真实情况也基本一样;当格网尺度为20~60 m时(图10d~10h),人口密度高值及人口密度值差异度和多样性都在逐渐降低,但尚能体现一定的人口分布差异,表达效果较好;从70 m格网开始,人口密度高值及人口密度值差异度和多样性进一步降低,一定程度上掩盖了人口分布差异,与真实情况有较大不同,数值信息表达效果较差。
5.2.3 空间关系表达度,40~200 m为表达效果较好格网尺度域 对于ALV指标,在40 m格网之前,其相对变化率数值较大,且变化较大,表明其结构特征变化较大;在40 m格网之后,其相对变化率数值较小,且变化较小,表明其结构特征变化较小;40 m格网为相对变化率数值曲线由逐渐降低到基本不变的转折点(图8)。综上,40 m格网为结构特征转折点。因为大于40 m格网的ALV指标数值较大,表达度较好,所以确定40~200 m为表达效果较好格网尺度域。在130 m格网处,平均局部方差达到最大值。依据ALV指标内涵,可知130 m格网处的空间关系表达度最好,从40 m到130 m和从200 m到130 m,空间关系表达度表达效果逐渐变好,研究区局域人口分布差异的表达效果越来越好。
5.2.4 确定适宜格网尺度域 图11展示了位置、数值信息、空间关系表达度的格网尺度适宜性分析结果。对于位置和数值信息表达度,两类指标的结果基本一致。理论上,格网单元越小,指标值越接近理想值,表达效果越好。随着格网单元的变大,会粗化人口分布位置,会掩盖人口密度差异特征,因此会导致人口分布位置及人口密度差异特征表达不准确。对于空间关系表达度,分析结果与位置和数值信息表达度结果相反,较小格网并不是适宜格网尺度。
人口空间数据格网尺度适宜性研究,所选取的适宜格网尺度不仅能较好揭示人口分布差异,还应能较准确地表达人口分布位置,因此需兼顾三个表达度的分析结果。本文以3个表达度确定的表达效果较好格网尺度域的交集,即40 m、50 m作为相对适宜的格网尺度。
针对本研究区,基于现有数据基础以及考虑人口空间数据的实用性,格网单元并不是越小越好。实际上5 m、10 m不是本研究区的适宜格网尺度。原因是:① 用很多较小的、人口密度值相同的格网单元来表达一个住宅用地斑块会导致数据冗余。研究区内住宅用地斑块面积> 3600 m2(斑块平均边长约为60 m)的所有斑块,其面积之和约占总斑块的82.3%,说明较大斑块(如60 m格网)占主要地位。理论上用一个60 m格网去表达该较大斑块(如60 m格网),效果最好;如果用较小格网(如5 m、10 m)去表征该较大斑块,意味着需用多个较小的、相同数值的栅格像元才能表达同一个大斑块,会导致数据冗余。② 研究区局部区域人口分布的空间差异小,使得适宜格网尺度理应趋大。研究区内面积比重约98.6%的住宅用地区域,其人口密度值< 5人/100 m2,可知局部区域人口分布的空间差异较小。用较小格网(如5 m、10 m)去表征该研究区的人口分布空间关系,会显得“浪费”。
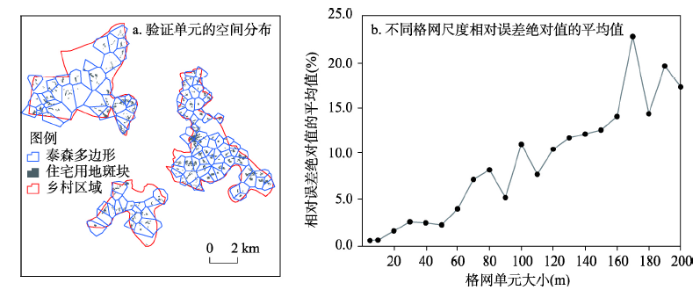
本文以自然村为验证单元,选用相对误差绝对值的平均值指标进行数值精度分析,评价适宜格网尺度的合理性。因自然村界线难以获取,借鉴学者采用泰森多边形代替行政边界的方式[26, 40],以自然村点位为数据源(数据来源于中国科学院资源环境科学数据中心),采用ArcGIS工具“Create Thiessen Polygons”建立泰森多边形,以此作为自然村近似边界。去除不含或含有较少住宅用地的多边形,最终构建126个多边形,作为自然村验证单元,面积范围为0.097~1.547 km2(图12a)。
图12 验证单元的空间分布及不同格网尺度下相对误差绝对值的平均值折线图
Fig. 12 The spatial distribution of verification units and the average absolute value of relative errors on different grid scales
数值精度分析的思路为:对人口空间数据进行区域统计,获取每个验证单元的“统计”人数,与验证单元的真实人数进行比较。不同格网尺度下,126个验证单元的“统计”人数由ArcGIS工具“Zonal Statistics as Table”来获取,而验证单元的真实人数从人口分布矢量数据获得。从而计算得到不同格网尺度下,126个验证单元的相对误差绝对值的平均值(图12b)。
图12b表明随着格网单元的变大,相对误差绝对值的平均值变大,人口空间数据的数值精度变低。与5 m、10 m、20 m格网相比,40 m、50 m格网尺度下的数值精度降低,但其相对误差绝对值的平均值分别为2.5%和2.3%,表明人口空间数据的数值精度损失很小。而其他大格网尺度下,相对误差绝对值的平均值明显升高,数值精度损失越来越大。因此,基于现有数据基础以及考虑人口空间数据的实用性,兼顾位置、数值信息、空间关系三方面表达度,及数值精度分析结果,有理由认为40 m、50 m格网是一个相对适宜的格网尺度,可作为生产本研究区高质量人口空间数据的适宜格网,同时也表明用五个指标来分析格网尺度适宜性是合理的、有效的。
本文提出一个从位置、数值信息和空间关系三个表达度来分析人口空间数据格网尺度适宜性的方案。首先,从理论上阐述了一致性量测指标(CM)、形状指数比(SIR)、人口密度标准差(SDPD)、斑块多样性(PDI)和平均局部方差(ALV)5个指标的选取原因。其次,通过构建格网尺度—指标数值之间的曲线及适宜格网尺度确定方案,确定适宜格网尺度域。最后,从数值精度分析角度,评价了适宜格网尺度的合理性。主要结论如下:
基于本文研究数据基以及人口空间数据的实用性,兼顾位置、数值信息、空间关系三方面表达度、数值精度分析结果,可知40 m、50 m格网是一个相对适宜的格网尺度,可作为生产本研究区高质量人口空间数据的适宜格网。初步研究表明,针对本研究区,从三个表达度方面,选用5个指标来分析格网尺度适宜性的方案是合理的、有效的。期望本文提出的格网尺度适宜性评价方案能够为生产高质量人口空间数据提供科学依据。
本文的不足之处在于,在空间关系表达度方面,选用较为常用的3×3窗口来计算平均局部方差值。研究表明窗口大小对平均局部方差方法探测遥感影像空间格局特征[20, 41]、提取地形地貌特征信息[42-43]会产生影响。后续研究将重点选用不同窗口大小,计算平均局部方差值,揭示窗口大小对分析结果的影响规律,以期进一步提高人口空间数据格网尺度适宜性研究结果的准确性。必须注意到,影响格网尺度适宜性的因素众多,例如研究区类型及大小、数据精细度等,后续研究应考虑以上因素。
The authors have declared that no competing interests exist.
| [1] |
Generating surface models of population using dasymetric mapping .https://doi.org/10.1111/0033-0124.10042 URL [本文引用: 1] 摘要
Aggregated demographic datasets are associated with analytical and cartographic problems due to the arbitrary nature of areal unit partitioning. This article describes a methodology for generating a surface-based representation of population that mitigates these problems. This methodology uses dasymetric mapping and incorporates areal weighting and empirical sampling techniques to assess the relationship between categorical ancillary data and population distribution. As a demonstration, a 100-meter-resolution population surface is generated from U.S. Census block group data for the southeast Pennsylvania region. Remote-sensing-derived urban land-cover data serve as ancillary data in the dasymetric mapping.
|
| [2] |
Analyzing spatial auto-correlation of population distribution: A case of Shenyang city .https://doi.org/10.3321/j.issn:1000-0585.2007.02.020 URL [本文引用: 1] 摘要
为探测经典城市人口密度模型在微观层面上的适用性,本文通过计算基于格网的沈阳市人口景观密度,利用地统计学的理论与方法来分析其空间自相关性和变异性。研究发现:在10种不同采样粒度上人口密度半变异函数都符合球状模型,表征着城市人口分布具有较强的空间自相关性和变异性;但由于粒度不同,人口密度的空间自相关尺度不同,块金值不同,基台值不同,块金值与基台值的比值差异较大,证明人口分布的空间自相关具有较强的尺度依赖性;对于700m粒度而言,通过计算不同方向的半变异函数曲线可以发现,沈阳市人口密度呈现典型的带状异向性,反映出人口分布在不同方向上具有不同的结构特征。因此,研究城市人口分布时,可以城市人口分布的自相关性和变异性分析为基础,并须充分注意适宜尺度的选择和结构特征的识别。
城市人口分布的空间自相关分析: 以沈阳市为例 .https://doi.org/10.3321/j.issn:1000-0585.2007.02.020 URL [本文引用: 1] 摘要
为探测经典城市人口密度模型在微观层面上的适用性,本文通过计算基于格网的沈阳市人口景观密度,利用地统计学的理论与方法来分析其空间自相关性和变异性。研究发现:在10种不同采样粒度上人口密度半变异函数都符合球状模型,表征着城市人口分布具有较强的空间自相关性和变异性;但由于粒度不同,人口密度的空间自相关尺度不同,块金值不同,基台值不同,块金值与基台值的比值差异较大,证明人口分布的空间自相关具有较强的尺度依赖性;对于700m粒度而言,通过计算不同方向的半变异函数曲线可以发现,沈阳市人口密度呈现典型的带状异向性,反映出人口分布在不同方向上具有不同的结构特征。因此,研究城市人口分布时,可以城市人口分布的自相关性和变异性分析为基础,并须充分注意适宜尺度的选择和结构特征的识别。
|
| [3] |
The grid scale effect analysis on town leveled population statistical data spatialization. Journal of
格网尺度效应是统计型人口数据空间化研究的基础性问题之一。针对资源环境研究领域和全球变化区域模型对各种尺度的空间型人口数据的需求,人们对人口数据空间化进行了大量研究。综观现有研究成果,缺乏针对具体应用需求的数据源选择方法和对数据产品适宜性的分析。因此,数据在实际应用中,特别是县市、二、三级流域等尺度上的应用中,存在较多的不确定性。本文重点研究人口数据空间化的格网尺度效应分析方法。以浙江省义乌市为例,利用CBERS、IRS-P5卫星影像,提取了研究区土地利用信息;在地理信息系统技术支持下,对乡镇统计人口进行空间化建模,生成20m至1km系列的格网人口数据;通过比较不同格网人口与乡镇统计人口的误差,分析人口数据空间化的格网尺度效应。分析结果表明,采用CBERS数据源进行人口数据空间化,其数据产品即格网人口的适宜尺度是200m,抽样精度为76%;采用P5数据源进行人口数据空间化,其格网人口的适宜尺度是100m,抽样精度为84%。
乡镇级人口统计数据空间化的格网尺度效应分析: 以义乌市为例 .
格网尺度效应是统计型人口数据空间化研究的基础性问题之一。针对资源环境研究领域和全球变化区域模型对各种尺度的空间型人口数据的需求,人们对人口数据空间化进行了大量研究。综观现有研究成果,缺乏针对具体应用需求的数据源选择方法和对数据产品适宜性的分析。因此,数据在实际应用中,特别是县市、二、三级流域等尺度上的应用中,存在较多的不确定性。本文重点研究人口数据空间化的格网尺度效应分析方法。以浙江省义乌市为例,利用CBERS、IRS-P5卫星影像,提取了研究区土地利用信息;在地理信息系统技术支持下,对乡镇统计人口进行空间化建模,生成20m至1km系列的格网人口数据;通过比较不同格网人口与乡镇统计人口的误差,分析人口数据空间化的格网尺度效应。分析结果表明,采用CBERS数据源进行人口数据空间化,其数据产品即格网人口的适宜尺度是200m,抽样精度为76%;采用P5数据源进行人口数据空间化,其格网人口的适宜尺度是100m,抽样精度为84%。
|
| [4] |
Analyzing scale effects of population density with Shenyang city as a case .https://doi.org/10.3969/j.issn.1002-1175.2007.02.008 URL [本文引用: 2] 摘要
以沈阳市为例,在对人口统计数据进行空间化处理的基础上,从统计 特征、空间自相关性和空间格局3个方面分析人口密度在10种粒度下的异同,充分证明了人口密度尺度效应的存在,并基于景观指数确定了沈阳市人口分布研究的 适宜尺度.本研究认为在使用人口密度这一指标来研究城市人口分布格局时,学者们必须面对尺度效应、选择适宜尺度,并充分考虑数据来源的尺度、分析的尺度、 结果表达的尺度以及它们之间的关系和转换.
城市人口密度的尺度效应分析: 以沈阳市为例 .https://doi.org/10.3969/j.issn.1002-1175.2007.02.008 URL [本文引用: 2] 摘要
以沈阳市为例,在对人口统计数据进行空间化处理的基础上,从统计 特征、空间自相关性和空间格局3个方面分析人口密度在10种粒度下的异同,充分证明了人口密度尺度效应的存在,并基于景观指数确定了沈阳市人口分布研究的 适宜尺度.本研究认为在使用人口密度这一指标来研究城市人口分布格局时,学者们必须面对尺度效应、选择适宜尺度,并充分考虑数据来源的尺度、分析的尺度、 结果表达的尺度以及它们之间的关系和转换.
|
| [5] |
Grid size suitability of population spatial distribution in Shandong Province based on landscape ecology. Geography and https://doi.org/10.7702/dlydlxxkx20140120 URL [本文引用: 2] 摘要
以山东省为研究区,在100m、200m、300m、400m、500m、600m、700m、800m、900m、1km 10个格网尺度人口格网数据的基础上,引入景观生态学的相关指数和方法,探索不同格网尺度表达人口空间分布的适宜性。结果表明:在用传统的基于土地利用/覆被的人口数据空间化方法进行人口空间化的过程中,并不是尺度越精细所能表达的信息越细致、完整,400m是一个人口尺度变化上的特征点,所反映的人口分布信息最细致且完整性好。由此可得,在进行山东省人口空间化的过程中,400m是一个比较适宜的尺度。
基于景观生态学的人口空间数据适宜格网尺度研究: 以山东省为例 .https://doi.org/10.7702/dlydlxxkx20140120 URL [本文引用: 2] 摘要
以山东省为研究区,在100m、200m、300m、400m、500m、600m、700m、800m、900m、1km 10个格网尺度人口格网数据的基础上,引入景观生态学的相关指数和方法,探索不同格网尺度表达人口空间分布的适宜性。结果表明:在用传统的基于土地利用/覆被的人口数据空间化方法进行人口空间化的过程中,并不是尺度越精细所能表达的信息越细致、完整,400m是一个人口尺度变化上的特征点,所反映的人口分布信息最细致且完整性好。由此可得,在进行山东省人口空间化的过程中,400m是一个比较适宜的尺度。
|
| [6] |
Spatial distribution of the population in Shandong Province at multi-scales .https://doi.org/10.11820/dlkxjz.2012.02.006 URL Magsci [本文引用: 1] 摘要
人口空间分布具有一定的尺度依赖性,从不同尺度上对人口空间分布格局进行分析,可以更确切、真实地揭示人口的空间分布规律,为制定区域发展规划、灾害评价、环境保护等提供科学依据。本文以山东省为研究区,运用空间自相关方法和统计相关分析方法,比较市级、县级、1 km三个尺度上人口分布的空间自相关性及其与环境—经济因子的统计相关性,试图探讨不同尺度下人口的空间分布模式及影响(指示)因素,从不同尺度揭示人口的空间分布格局特征。结果表明:①从不同尺度对人口的空间分布格局进行分析,可以得到从宏观到微观不同详细程度的信息。从市级尺度分析,可以得到山东省整体的人口空间分布特征;从县级尺度分析,可以得到山东省各市内部的人口空间分布特征;从1 km尺度分析,可以得到山东省各县内部的人口空间分布特征。②不同尺度上,人口的空间分布格局特征不同。市级和县级尺度上,人口分布受环境—经济因子的影响表现出与一些因子显著相关,而受空间集聚的作用较小;1 km尺度上,人口分布与环境—经济因子的相关性较小,而主要受空间集聚的作用,在县内部,人口往往集中分布于某一区域,呈现出典型的集聚分布模式。
山东省人口空间分布格局的多尺度分析 .https://doi.org/10.11820/dlkxjz.2012.02.006 URL Magsci [本文引用: 1] 摘要
人口空间分布具有一定的尺度依赖性,从不同尺度上对人口空间分布格局进行分析,可以更确切、真实地揭示人口的空间分布规律,为制定区域发展规划、灾害评价、环境保护等提供科学依据。本文以山东省为研究区,运用空间自相关方法和统计相关分析方法,比较市级、县级、1 km三个尺度上人口分布的空间自相关性及其与环境—经济因子的统计相关性,试图探讨不同尺度下人口的空间分布模式及影响(指示)因素,从不同尺度揭示人口的空间分布格局特征。结果表明:①从不同尺度对人口的空间分布格局进行分析,可以得到从宏观到微观不同详细程度的信息。从市级尺度分析,可以得到山东省整体的人口空间分布特征;从县级尺度分析,可以得到山东省各市内部的人口空间分布特征;从1 km尺度分析,可以得到山东省各县内部的人口空间分布特征。②不同尺度上,人口的空间分布格局特征不同。市级和县级尺度上,人口分布受环境—经济因子的影响表现出与一些因子显著相关,而受空间集聚的作用较小;1 km尺度上,人口分布与环境—经济因子的相关性较小,而主要受空间集聚的作用,在县内部,人口往往集中分布于某一区域,呈现出典型的集聚分布模式。
|
| [7] |
Improving large area population mapping using geotweet densities. Transactions in https://doi.org/10.1111/tgis.12214 URL PMID: 5412862 [本文引用: 1] 摘要
Many different methods are used to disaggregate census data and predict population densities to construct finer scale, gridded population data sets. These methods often involve a range of high resolution geospatial covariate datasets on aspects such as urban areas, infrastructure, land cover and topography; such covariates, however, are not directly indicative of the presence of people. Here we tested the potential of geo-located tweets from the social media application, Twitter, as a covariate in the production of population maps. The density of geo-located tweets in 1x1 km grid cells over a 2-month period across Indonesia, a country with one of the highest Twitter usage rates in the world, was input as a covariate into a previously published random forests-based census disaggregation method. Comparison of internal measures of accuracy and external assessments between models built with and without the geotweets showed that increases in population mapping accuracy could be obtained using the geotweet densities as a covariate layer. The work highlights the potential for such social media-derived data in improving our understanding of population distributions and offers promise for more dynamic mapping with such data being continually produced and freely available
|
| [8] |
Determining global population distribution: Methods, applications and data .https://doi.org/10.1016/S0065-308X(05)62004-0 URL PMID: 3154651 [本文引用: 1] 摘要
Evaluating the total numbers of people at risk from infectious disease in the world requires not just tabular population data, but data that are spatially explicit and global in extent at a moderate resolution. This review describes the basic methods for constructing estimates of global population distribution with attention to recent advances in improving both spatial and temporal resolution. To evaluate the optimal resolution for the study of disease, the native resolution of the data inputs as well as that of the resulting outputs are discussed. Assumptions used to produce different population data sets are also described, with their implications for the study of infectious disease. Lastly, the application of these population data sets in studies to assess disease distribution and health impacts is reviewed. The data described in this review are distributed in the accompanying DVD.
|
| [9] |
LandScan USA: A high-resolution geospatial and temporal modeling approach for population distribution and dynamics .https://doi.org/10.1007/s10708-007-9105-9 URL [本文引用: 1] 摘要
High-resolution population distribution data are critical for successfully addressing important issues ranging from socio-environmental research to public health to homeland security, since scientific analyses, operational activities, and policy decisions are significantly influenced by the number of impacted people. Dasymetric modeling has been a well-recognized approach for spatial decomposition of census data to increase the spatial resolution of population distribution. However, enhancing the temporal resolution of population distribution poses a greater challenge. In this paper, we discuss the development of LandScan USA, a multi-dimensional dasymetric modeling approach, which has allowed the creation of a very high-resolution population distribution data both over space and time. At a spatial resolution of 3 arc seconds ( 90 m), the initial LandScan USA database contains both a nighttime residential as well as a baseline daytime population distribution that incorporates movement of workers and students. Challenging research issues of disparate and misaligned spatial data and modeling to develop a database at a national scale, as well as model verification and validation approaches are illustrated and discussed. Initial analyses indicate a high degree of locational accuracy for LandScan USA distribution model and data. High-resolution population data such as LandScan USA, which describes both distribution and dynamics of human population, clearly has the potential to profoundly impact multiple domain applications of national and global priority.
|
| [10] |
Global Rural-Urban Mapping Project (GRUMP), Alpha Version: Urban extents New York: Center for International Earth Science Information Network (CIESIN), |
| [11] |
|
| [12] |
Population distribution, settlement patterns and accessibility across Africa in 2010 . |
| [13] |
Disaggregating census data for population mapping using random forests with remotely-sensed and ancillary data .https://doi.org/10.1371/journal.pone.0107042 URL PMID: 25689585 [本文引用: 1] 摘要
Abstract High resolution, contemporary data on human population distributions are vital for measuring impacts of population growth, monitoring human-environment interactions and for planning and policy development. Many methods are used to disaggregate census data and predict population densities for finer scale, gridded population data sets. We present a new semi-automated dasymetric modeling approach that incorporates detailed census and ancillary data in a flexible, "Random Forest" estimation technique. We outline the combination of widely available, remotely-sensed and geospatial data that contribute to the modeled dasymetric weights and then use the Random Forest model to generate a gridded prediction of population density at ~100 m spatial resolution. This prediction layer is then used as the weighting surface to perform dasymetric redistribution of the census counts at a country level. As a case study we compare the new algorithm and its products for three countries (Vietnam, Cambodia, and Kenya) with other common gridded population data production methodologies. We discuss the advantages of the new method and increases over the accuracy and flexibility of those previous approaches. Finally, we outline how this algorithm will be extended to provide freely-available gridded population data sets for Africa, Asia and Latin America.
|
| [14] |
High resolution population distribution maps for Southeast Asia in 2010 and 2015 .https://doi.org/10.1371/journal.pone.0055882 URL PMID: 3572178 [本文引用: 1] 摘要
Spatially accurate, contemporary data on human population distributions are vitally important to many applied and theoretical researchers. The Southeast Asia region has undergone rapid urbanization and population growth over the past decade, yet existing spatial population distribution datasets covering the region are based principally on population count data from censuses circa 2000, with often insufficient spatial resolution or input data to map settlements precisely. Here we outline approaches to construct a database of GIS-linked circa 2010 census data and methods used to construct fine-scale ( 100 meters spatial resolution) population distribution datasets for each country in the Southeast Asia region. Landsat-derived settlement maps and land cover information were combined with ancillary datasets on infrastructure to model population distributions for 2010 and 2015. These products were compared with those from two other methods used to construct commonly used global population datasets. Results indicate mapping accuracies are consistently higher when incorporating land cover and settlement information into the AsiaPop modelling process. Using existing data, it is possible to produce detailed, contemporary and easily updatable population distribution datasets for Southeast Asia. The 2010 and 2015 datasets produced are freely available as a product of the AsiaPop Project and can be downloaded from: www.asiapop.org.
|
| [15] |
Method of pixelizing population data .https://doi.org/10.3321/j.issn:0375-5444.2002.z1.010 URL [本文引用: 1] 摘要
在人口空间分布区划的基础上,利用基于LANDSATTM信息获取的1:10万比例尺的土地利用/覆盖数据,建立与统计人口数据的多元相关关系模型,计算各种土地利用类型中的居住人口系数,在GIS支持下计算出全国lkm格网人口空间分布数据,然后结合DEM数据、居民点分布数据对空间化处理结果进行修正,并在各大区内随机抽样若干县采集乡镇行政边界和统计人口数据对模犁计算结果进行了验证。
人口数据空间化的处理方法 .https://doi.org/10.3321/j.issn:0375-5444.2002.z1.010 URL [本文引用: 1] 摘要
在人口空间分布区划的基础上,利用基于LANDSATTM信息获取的1:10万比例尺的土地利用/覆盖数据,建立与统计人口数据的多元相关关系模型,计算各种土地利用类型中的居住人口系数,在GIS支持下计算出全国lkm格网人口空间分布数据,然后结合DEM数据、居民点分布数据对空间化处理结果进行修正,并在各大区内随机抽样若干县采集乡镇行政边界和统计人口数据对模犁计算结果进行了验证。
|
| [16] |
A fine-scale spatial population distribution on the high-resolution gridded population surface and application in Alachua County, Florida .https://doi.org/10.1016/j.apgeog.2014.02.009 URL [本文引用: 1] 摘要
Geospatial techniques, using Geographic Information Systems and remote sensing data, have become more commonly used with dasymetric modeling of fine-scale demographic data. In this study, we apply a dasymetric approach using the Heuristic Sampling Method for 2010 parcel data to disaggregate population counts from the 2010 U.S. Census into a quadrilateral grid composed of 30 30mcells covering the Alachua County, Florida. The final output, termed the High-resolution Gridded Population Surface (HGPS), is compared to a land cover-based population product (LCPP) and the detail of each product is assessed. Results suggest that the HGPS provides increased spatial heterogeneity and more detail in the boundaries of populated areas over the use of census blocks or land cover lots. For an example of the final output, we use a case study at the Cabot oppers Superfund Site to demonstrate the advantages of the HGPS over the LCPP. The HGPS is expected to serve as a more accurate input in various research fields, such as public health, crime analysis, and climate change. The approach outlined provides an improved means of producing spatially-explicit population grids where fine-scale ancillary data, such as parcel data, is available.
|
| [17] |
The analysis of population spatial distribution characteristics based of grid [D].基于格网的城市人口空间分布特征分析 [D]: |
| [18] |
High resolution population maps for low income nations: Combining land cover and census in East Africa .https://doi.org/10.1371/journal.pone.0001298 URL PMID: 2110897 [本文引用: 1] 摘要
Between 2005 and 2050, the human population is forecast to grow by 2.7 billion, with the vast majority of this growth occurring in low income countries. This growth is likely to have significant social, economic and environmental impacts, and make the achievement of international development goals more difficult. The measurement, monitoring and potential mitigation of these impacts require high resolution, contemporary data on human population distributions. In low income countries, however, where the changes will be concentrated, the least information on the distribution of population exists. In this paper we investigate whether satellite imagery in combination with land cover information and census data can be used to create inexpensive, high resolution and easily-updatable settlement and population distribution maps over large areas.We examine various approaches for the production of maps of the East African region (Kenya, Uganda, Burundi, Rwanda and Tanzania) and where fine resolution census data exists, test the accuracies of map production approaches and existing population distribution products. The results show that combining high resolution census, settlement and land cover information is important in producing accurate population distribution maps.We find that this semi-automated population distribution mapping at unprecedented spatial resolution produces more accurate results than existing products and can be undertaken for as little as $0.01 per km(2). The resulting population maps are a product of the Malaria Atlas Project (MAP: http://www.map.ox.ac.uk) and are freely available.
|
| [19] |
Evaluation of the optimal resolution for characterizing the effect of beach surface moisture derived from remote sensing on aeolian transport .https://doi.org/10.1002/ijc.29015 URL [本文引用: 2] 摘要
This paper explores new possibilities offered by moisture maps obtained from a remote sensing system to evaluate the effect of measuring moisture at different spatial resolutions. The data are derived from a moisture map generated from an image taken during an aeolian event on October 21, 2007 at Greenwich Dunes, Prince Edward Island National Park, Canada, using a camera mounted on a mast on the foredune crest at a height of about 14 m above the beach. Data from the original, fine resolution (0.05 m) moisture map was gradually aggregated through pixel coarsening. The simple method of local variance was used to identify the grid resolution at which changes in moisture were best depicted. Results indicate that the optimal spatial resolution at which most moisture variability was conveyed within a moisture map was 0.6-0.9 m, which suggests that finer resolutions do not necessarily provide the best representation of surface moisture that could be used in predictions of aeolian sediment transport.
|
| [20] |
Spatial scale of remote sensing image and selection of optimal spatial resolution .https://doi.org/10.3321/j.issn:1007-4619.2008.04.001 URL Magsci [本文引用: 1] 摘要
尺度概念是理解地球系统复杂性的关键,尺度问题被认为是对地观测 的主要挑战之一,而结合具体研究应用领域,由地学现象的尺度本身出发,选择所需遥感影像的最佳尺度和分辨率,是非常有现实意义的.本文在深入剖析了遥感影 像的尺度特性和遥感影像尺度选择的意义的基础上,探讨了基于地统计学方法定量选择遥感影像最佳空间分辨率的方法.阐明了传统局部方差方法不能得到理想结果 的原因:传统的局部方差方法的实质是基于变化地面面积计算影像局部方差的均值,而基于这样不同甚至是相差悬殊的地面面积进行局部方差计算,其结果必然不具 有可比性.对此,本文提出了基于可变窗口与可变分辨率的改进局部方差方法,即依次降低空间分辨率时,高分辨率采用大窗口尺寸,低分辨率采用小窗口尺寸来维 持计算窗口内的地面面积的一致,由此计算出的局部方差作比较来判定遥感影像最佳分辨率.进行了系列实验分析,得到了相关结论,分析得出这种基于地统计的方 法来选择遥感影像最佳分辨率的方法,对遥感和GIS研究与地学应用具有一定的理论意义和指导意义.
遥感影像空间尺度特性与最佳空间分辨率选择 .https://doi.org/10.3321/j.issn:1007-4619.2008.04.001 URL Magsci [本文引用: 1] 摘要
尺度概念是理解地球系统复杂性的关键,尺度问题被认为是对地观测 的主要挑战之一,而结合具体研究应用领域,由地学现象的尺度本身出发,选择所需遥感影像的最佳尺度和分辨率,是非常有现实意义的.本文在深入剖析了遥感影 像的尺度特性和遥感影像尺度选择的意义的基础上,探讨了基于地统计学方法定量选择遥感影像最佳空间分辨率的方法.阐明了传统局部方差方法不能得到理想结果 的原因:传统的局部方差方法的实质是基于变化地面面积计算影像局部方差的均值,而基于这样不同甚至是相差悬殊的地面面积进行局部方差计算,其结果必然不具 有可比性.对此,本文提出了基于可变窗口与可变分辨率的改进局部方差方法,即依次降低空间分辨率时,高分辨率采用大窗口尺寸,低分辨率采用小窗口尺寸来维 持计算窗口内的地面面积的一致,由此计算出的局部方差作比较来判定遥感影像最佳分辨率.进行了系列实验分析,得到了相关结论,分析得出这种基于地统计的方 法来选择遥感影像最佳分辨率的方法,对遥感和GIS研究与地学应用具有一定的理论意义和指导意义.
|
| [21] |
The factor of scale in remote sensing .https://doi.org/10.1016/0034-4257(87)90015-0 URL [本文引用: 3] 摘要
Thanks to such second- and third-generation sensor systems as Thematic Mapper, SPOT, and AVHRR, a user of digital satellite imagery for remote sensing of the earth's surface now has a choice of image scales ranging from 10 m to 1 km. The choice of an appropriate scale, or spatial resolution, for a particular application depends on several factors. These include the information desired about the ground scene, the analysis methods to be used to extract the information, and the spatial structure of the scene itself. A graph showing how the local variance of a digital image for a scene changes as the resolution-cell size changes can help in selecting an appropriate image scale. Such graphs are obtained by imaging the scene at fine resolution and then collapsing the image to successively coarser resolutions while calculating a measure of local variance. The local variance/resolution graphs for the forested, agricultural, and urban/suburban environments examined in this paper reveal the spatial structure of each type of scene, which is a function of the sizes and spatial relationships of the objects the scene contains. At the spatial resolutions of SPOT and Thematic Mapper imagery, local image variance is relatively high for forested and urban/suburban environments, suggesting that information-extracting techniques utilizing texture, context, and mixture modeling are appropriate for these sensor systems. In agricultural environments, local variance is low, and the more traditional classifiers are appropriate.
|
| [22] |
Are fine resolution digital elevation models always the best choice in digital soil mapping? https://doi.org/10.1016/j.geoderma.2012.11.020 URL [本文引用: 2] 摘要
Digital Elevation Models (DEMs) are fundamental in assessing soil variability and are regularly used in Digital Soil Mapping (DSM) as a scale benchmark for all the other environmental covariates. They are conventionally used at their original grid resolution with a conventional 3 3 window size for the computation of the derived terrain attributes. The choice of scale frames the analysis and shapes the end result suggesting that better attention and quantitative knowledge of scale may improve predictive performance. Previous studies have shown the influence of pixel size but have not investigated in detail the interacting effect between window and pixel sizes. The aim of this study was to examine the scale dependency of soil classification performance at the landscape scale using two machine-learning techniques commonly applied in DSM: artificial neural networks and random forest. These were applied in three different areas in terms of their geomorphology and soil type located in Ireland. A series of DEMs representing different scales were created from the original 20 m DEM by smoothing and re-sampling it with different window and pixel sizes for a total of 143 combinations: the original, 10 smoothed but not re-sampled, 12 re-sampled and not smoothed, and 120 smoothed and re-sampled. These were used to generate 11 terrain parameters from which 4 points per km 2 were randomly extracted and used to predict soil classes. The overall prediction accuracy in the three study areas varied between 35% and 60%. Pixel size was found significant in all areas, the interaction between window and pixel sizes significant in morphologically rough areas and window size was significant only in flat homogeneous areas at coarser resolutions (above 140 m in this study). In general, predictive performance was best at very fine and very coarse scales in morphologically varied areas, coarse scales in flat homogenous areas and relatively scale invariant in mixed areas. We conclude by examining whether this empirical approach is appropriate to compare scale combinations to obtain a better prediction accuracy of DSM techniques.
|
| [23] |
Local variance for multi-scale analysis in geomorphometry .https://doi.org/10.1016/j.geomorph.2011.03.011 URL PMID: 3115023 [本文引用: 1] 摘要
Abstract Increasing availability of high resolution Digital Elevation Models (DEMs) is leading to a paradigm shift regarding scale issues in geomorphometry, prompting new solutions to cope with multi-scale analysis and detection of characteristic scales. We tested the suitability of the local variance (LV) method, originally developed for image analysis, for multi-scale analysis in geomorphometry. The method consists of: 1) up-scaling land-surface parameters derived from a DEM; 2) calculating LV as the average standard deviation (SD) within a 30002010300023 moving window for each scale level; 3) calculating the rate of change of LV (ROC-LV) from one level to another, and 4) plotting values so obtained against scale levels. We interpreted peaks in the ROC-LV graphs as markers of scale levels where cells or segments match types of pattern elements characterized by (relatively) equal degrees of homogeneity. The proposed method has been applied to LiDAR DEMs in two test areas different in terms of roughness: low relief and mountainous, respectively. For each test area, scale levels for slope gradient, plan, and profile curvatures were produced at constant increments with either resampling (cell-based) or image segmentation (object-based). Visual assessment revealed homogeneous areas that convincingly associate into patterns of land-surface parameters well differentiated across scales. We found that the LV method performed better on scale levels generated through segmentation as compared to up-scaling through resampling. The results indicate that coupling multi-scale pattern analysis with delineation of morphometric primitives is possible. This approach could be further used for developing hierarchical classifications of landform elements.
|
| [24] |
Effects of different topographic attributes on determining appropriate DEM resolution .https://doi.org/10.11820/dlkxjz.2014.01.006 URL Magsci [本文引用: 3] 摘要
分辨率会直接影响基于栅格数字高程模型(DEM)的数字地形分析结果,因此在实际应用中,需要选择适宜的DEM分辨率。目前采取的基本方法,基于某种地形信息定量刻画尺度效应曲线,从而确定DEM适宜分辨率,但对于采用不同地形信息时所产生的影响尚缺乏研究。本文针对该方法中通常采用的坡度、剖面曲率、水平曲率等3 种地形信息,每种地形信息提取时,分别使用两种不同的常用算法,在3 个不同地形特征的研究区中,逐一计算其在不同分辨率下的局部方差均值,以刻画尺度效应曲线,确定相应的DEM适宜分辨率,并进行对比分析。结果表明:① 采用剖面曲率或水平曲率所得适宜分辨率结果基本相同,但采用坡度所得出的适宜分辨率结果则有明显差别,后者所得的适宜分辨率更粗;② 采用不同地形信息时,越是在平缓地形为主的研究区,所得的适宜分辨率结果越相近,在复合地形特征的研究区所得到的适宜分辨率区间均明显较宽;③ 地形属性计算时所用的算法对适宜分辨率结果的影响不明显。
地形信息对确定DEM适宜分辨率的影响 .https://doi.org/10.11820/dlkxjz.2014.01.006 URL Magsci [本文引用: 3] 摘要
分辨率会直接影响基于栅格数字高程模型(DEM)的数字地形分析结果,因此在实际应用中,需要选择适宜的DEM分辨率。目前采取的基本方法,基于某种地形信息定量刻画尺度效应曲线,从而确定DEM适宜分辨率,但对于采用不同地形信息时所产生的影响尚缺乏研究。本文针对该方法中通常采用的坡度、剖面曲率、水平曲率等3 种地形信息,每种地形信息提取时,分别使用两种不同的常用算法,在3 个不同地形特征的研究区中,逐一计算其在不同分辨率下的局部方差均值,以刻画尺度效应曲线,确定相应的DEM适宜分辨率,并进行对比分析。结果表明:① 采用剖面曲率或水平曲率所得适宜分辨率结果基本相同,但采用坡度所得出的适宜分辨率结果则有明显差别,后者所得的适宜分辨率更粗;② 采用不同地形信息时,越是在平缓地形为主的研究区,所得的适宜分辨率结果越相近,在复合地形特征的研究区所得到的适宜分辨率区间均明显较宽;③ 地形属性计算时所用的算法对适宜分辨率结果的影响不明显。
|
| [25] |
Study on spatial distribution of statistical data in regional ecology and environment assessment: A case study of Shandong Province [D].区域生态环境评价中的统计数据空间化方法研究 [D]: |
| [26] |
Census spatialization based on Thiessen polygons and grids .利用泰森多边形和格网平滑的人口密度空间化研究: 以徐州市为例 . |
| [27] |
GIS based urban population spatial distribution model and application in Changchun .https://doi.org/10.3771/j.issn.1009-2307.2008.04.057 URL [本文引用: 1] 摘要
本文主要研究城市人口空间分布模型在长春市区的应用,目的在于模拟长春市区人口的空间分布情况。本文参考前人研究的基于城镇面积的城市人口密度系数模型,同时考虑交通网对城市人口分布的影响,提出适合长春市区人口空间分布的模型,生成100m(100m网格的人口数据空间分布图。为验证该模型的准确性,将建模所得数据与人口统计数据以街道为单位进行对比,发现模拟结果与调查数据基本相符。
基于GIS的城市人口空间分布模型与应用: 以长春市区为例 .https://doi.org/10.3771/j.issn.1009-2307.2008.04.057 URL [本文引用: 1] 摘要
本文主要研究城市人口空间分布模型在长春市区的应用,目的在于模拟长春市区人口的空间分布情况。本文参考前人研究的基于城镇面积的城市人口密度系数模型,同时考虑交通网对城市人口分布的影响,提出适合长春市区人口空间分布的模型,生成100m(100m网格的人口数据空间分布图。为验证该模型的准确性,将建模所得数据与人口统计数据以街道为单位进行对比,发现模拟结果与调查数据基本相符。
|
| [28] |
Grid scale effect and spatialization of population density based on the characteristic of spatial autocorrelation in Shiyang River Basin .https://doi.org/10.11867/j.issn.1001-8166.2012.12.1363 URL Magsci [本文引用: 1] 摘要
<p>以石羊河流域为例,运用GCAWI法、空间自相关指数以及考虑空间自相关性的多(单)中心指数模型等实现了乡镇单元向格网单元图层的转化、适宜格网大小的确定以及人口密度的空间模拟。结果表明:①石羊河流域人口密度的空间分布差异较大而又相对集中,具有“3点4线3区”的“点—线—区”状空间结构;②不同单元大小的格网图层提高了流域整体的空间自相关性,Moran’s I指数表现出较大的差异性和偶然性;③石羊河流域人口密度空间分布存在明显的正空间自相关,8 000~10 000 m是表现流域人口密度空间分布特征的最优选择范围;④空间自相关性影响下的人口密度空间化多(单)中心模型大大提高传统指数模型的精度,却改变了距离衰减系数的性质和大小,多中心和单中心模型模拟系数的差异主要是由金昌人口密度中心引起的。</p>
基于空间自相关特征的人口密度格网尺度效应与空间化研究: 以石羊河流域为例 .https://doi.org/10.11867/j.issn.1001-8166.2012.12.1363 URL Magsci [本文引用: 1] 摘要
<p>以石羊河流域为例,运用GCAWI法、空间自相关指数以及考虑空间自相关性的多(单)中心指数模型等实现了乡镇单元向格网单元图层的转化、适宜格网大小的确定以及人口密度的空间模拟。结果表明:①石羊河流域人口密度的空间分布差异较大而又相对集中,具有“3点4线3区”的“点—线—区”状空间结构;②不同单元大小的格网图层提高了流域整体的空间自相关性,Moran’s I指数表现出较大的差异性和偶然性;③石羊河流域人口密度空间分布存在明显的正空间自相关,8 000~10 000 m是表现流域人口密度空间分布特征的最优选择范围;④空间自相关性影响下的人口密度空间化多(单)中心模型大大提高传统指数模型的精度,却改变了距离衰减系数的性质和大小,多中心和单中心模型模拟系数的差异主要是由金昌人口密度中心引起的。</p>
|
| [29] |
Research progress and perspective on the spatialization of population data. Journal of https://doi.org/10.3724/SP.J.1047.2016.01295 URL Magsci [本文引用: 1] 摘要
人口数据空间化旨在揭示人口在地理空间上的分布位置及数量信息,展现人口统计数据的地理学含义,其研究已经成为人口学、地理学、GIS领域的研究热点。人口空间数据库在各级政府部门的规划和决策、灾害评估、资源配置等方面,具有重要的应用价值和科学意义。经过近30年的发展,人口数据空间化研究水平逐渐成熟,模型丰富多样,已获得众多成果。为把握人口空间化研究的研究现状,本文首先依据研究目的、建模思想及模型原理的异同,从3个方面对人口空间化研究进行梳理:(1)格网大小(尺度)的确定;(2)3种常用建模思想及6类主要模型的对比分析;(3)提高人口空间化精度的措施及其应用背景、优点。在此基础上,依据现阶段人口数据空间化的研究内容,从格网尺度适宜性研究、高时空分辨率人口空间分布模拟、引入新型数据源及多思想多模型综合应用等方面探讨了人口数据空间化的研究方向。
人口数据空间化研究进展 .https://doi.org/10.3724/SP.J.1047.2016.01295 URL Magsci [本文引用: 1] 摘要
人口数据空间化旨在揭示人口在地理空间上的分布位置及数量信息,展现人口统计数据的地理学含义,其研究已经成为人口学、地理学、GIS领域的研究热点。人口空间数据库在各级政府部门的规划和决策、灾害评估、资源配置等方面,具有重要的应用价值和科学意义。经过近30年的发展,人口数据空间化研究水平逐渐成熟,模型丰富多样,已获得众多成果。为把握人口空间化研究的研究现状,本文首先依据研究目的、建模思想及模型原理的异同,从3个方面对人口空间化研究进行梳理:(1)格网大小(尺度)的确定;(2)3种常用建模思想及6类主要模型的对比分析;(3)提高人口空间化精度的措施及其应用背景、优点。在此基础上,依据现阶段人口数据空间化的研究内容,从格网尺度适宜性研究、高时空分辨率人口空间分布模拟、引入新型数据源及多思想多模型综合应用等方面探讨了人口数据空间化的研究方向。
|
| [30] |
Study on China's criteria for urban-rural dividing [D].我国城乡划分标准研究 [D]: |
| [31] |
A method for demographic data spatialization based on residential space attributes .https://doi.org/10.18306/dlkxjz.2016.11.002 URL [本文引用: 1] 摘要
精细尺度的人口分布是当前人口地理学研究的热点和难点,在灾害评估、资源配置、智慧城市建设等方面应用广泛。居住建筑物尺度作为精细尺度的重要内容,其人口数据空间化日益引起学术界的关注。本文以居住建筑斑块面积、斑块内建筑面积比重、建筑物层数、公摊率等居住空间属性为人口分布数量的指示因子,以居住建筑的轮廓斑块为人口分布位置的指示因子,利用街道界线和街道常住人口数据为控制单元,建立线性模型,获得了2015年宣城市宣州区6个街道的居住建筑物尺度的人口分布矢量数据,刻画了城市市区人口空间分布的细节信息。结果表明:(1)以居住空间属性作为人口空间分布的指示因子,获取的人口空间数据精度高,结果可信。29个社区(村)估算人数的相对误差绝对值的平均值低于7%,其中25个社区(村)的相对误差绝对值低于10%。在1102个居住建筑斑块中,估算人数在合理区内的斑块个数占比高于74%,轻微低估区(-10%,0)和轻微高估区(0,10%)的斑块总数占比高于9%;(2)由斑块面积和建筑物层数共同表征的建筑物体积,是建筑物尺度上影响人口空间分布的关键因素;斑块内建筑面积比重属性能进一步提高模型精度;公摊率属性具有"降高升低"作用,但将估算人数调节到合理区的"能力"较弱。
基于居住空间属性的人口数据空间化方法研究 .https://doi.org/10.18306/dlkxjz.2016.11.002 URL [本文引用: 1] 摘要
精细尺度的人口分布是当前人口地理学研究的热点和难点,在灾害评估、资源配置、智慧城市建设等方面应用广泛。居住建筑物尺度作为精细尺度的重要内容,其人口数据空间化日益引起学术界的关注。本文以居住建筑斑块面积、斑块内建筑面积比重、建筑物层数、公摊率等居住空间属性为人口分布数量的指示因子,以居住建筑的轮廓斑块为人口分布位置的指示因子,利用街道界线和街道常住人口数据为控制单元,建立线性模型,获得了2015年宣城市宣州区6个街道的居住建筑物尺度的人口分布矢量数据,刻画了城市市区人口空间分布的细节信息。结果表明:(1)以居住空间属性作为人口空间分布的指示因子,获取的人口空间数据精度高,结果可信。29个社区(村)估算人数的相对误差绝对值的平均值低于7%,其中25个社区(村)的相对误差绝对值低于10%。在1102个居住建筑斑块中,估算人数在合理区内的斑块个数占比高于74%,轻微低估区(-10%,0)和轻微高估区(0,10%)的斑块总数占比高于9%;(2)由斑块面积和建筑物层数共同表征的建筑物体积,是建筑物尺度上影响人口空间分布的关键因素;斑块内建筑面积比重属性能进一步提高模型精度;公摊率属性具有"降高升低"作用,但将估算人数调节到合理区的"能力"较弱。
|
| [32] |
A personal construct-based knowledge acquisition process for natural resource mapping .https://doi.org/10.1080/136588199241382 URL [本文引用: 1] 摘要
This paper presents an iterative, structured knowledge-acquisition process for extracting human understanding of relationships between a natural resource and its environment. This understanding can then be used to map natural resources as spatial continua. The knowledge acquisition process is based on personal construct theory and consists of several iterations. Each iteration has five structured interview sessions: preparation, key development, description, comparison, and quantification. The knowledge derived from each iteration is represented as a set of membership functions that describes the degree to which a given environmental condition impacts the status of the given resource. The final set of membership functions, which is the final version of knowledge, is derived through the comparison and ''fusion'' of the membership functions from each iteration. The comparison of the membership functions among different iterations is also used to measure the consistency (integrity) of an expert''s understanding of the relationships. In a soil mapping case study, knowledge on soil-environment relationships was acquired from a local soil scientist using the knowledge acquisition process. The case study shows that knowledge sets extracted a year apart were consistent with each other. The study also shows that the soil expert was more familiar with the relationships between soils and some environmental variables than with other environmental variables. The expert''s understanding about soil-environmental relationships also differed among soil series. Although it was designed to extract expert knowledge for mapping natural resources as spatial continua under a GIS environment, this knowledge elicitation process can be easily adapted to extract expert knowledge for other knowledge-based applications.
|
| [33] |
Empirical patterns of the effects of changing scale on landscape metrics .https://doi.org/10.1023/A:1022995922992 Magsci [本文引用: 1] 摘要
<a name="Abs1"></a>While ecologists are well aware that spatial heterogeneity is scale-dependent, a general understanding of scaling relationships of spatial pattern is still lacking. One way to improve this understanding is to systematically examine how pattern indices change with scale in real landscapes of different kinds. This study, therefore, was designed to investigate how a suite of commonly used landscape metrics respond to changing grain size, extent, and the direction of analysis (or sampling) using several different landscapes in North America. Our results showed that the responses of the 19 landscape metrics fell into three general categories: Type I metrics showed predictable responses with changing scale, and their scaling relations could be represented by simple scaling equations (linear, power-law, or logarithmic functions); Type II metrics exhibited staircase-like responses that were less predictable; and Type III metrics behaved erratically in response to changing scale, suggesting no consistent scaling relations. In general, the effect of changing grain size was more predictable than that of changing extent. Type I metrics represent those landscape features that can be readily and accurately extrapolated or interpolated across spatial scales, whereas Type II and III metrics represent those that require more explicit consideration of idiosyncratic details for successful scaling. To adequately quantify spatial heterogeneity, the metric-scalograms (the response curves of metrics to changing scale), instead of single-scale measures, seem necessary.
|
| [34] |
Opposite trends in response for the Shannon and simpson indices of landscape diversity .https://doi.org/10.1016/S0143-6228(02)00002-4 URL [本文引用: 1] 摘要
Among the most popular of metrics used to quantify landscape composition are Shannon’s index, believed to emphasize the richness component of diversity, and Simpson’s index, emphasizing the evenness component. These indices can show considerable variation in response to changes in landscape richness and evenness. However, the possibility of encountering opposite trends in the responses of these indices to assemblages that differ in only a single component of diversity has not been sufficiently acknowledged. An opposite response of these indices was observed for two Indian landscapes with the same richness, differing only in evenness. Using a numerical simulation, the likelihood of encountering landscapes with an opposite response was demonstrated to increase with increasing richness, from about 4% for landscapes consisting of three cover types, to about 6% for ten types. This emphasizes the need for caution when choosing an index of landscape diversity. Rare cover types provide habitats for sensitive species and facilitate critical ecological processes. The Shannon index, sensitive to their presence, is therefore recommended for landscape management within an ecological framework. Simpson’s index, more responsive to the dominant cover type, can be used for specific situations where the dominant cover type is of interest, such as single-species reserve design.
|
| [35] |
Investigating spatiotemporal patterns of landscape diversity in response to urbanization .https://doi.org/10.1016/j.landurbplan.2009.07.002 URL [本文引用: 1] 摘要
Landscape patterns in urban regions are usually influenced by human-induced change in land cover in the processes of urbanization. Landscape spatial patterns have profound implications for the functions of ecological systems, and landscape diversity is an effective parameter representing landscape spatial patterns. However, the dynamics of landscape diversity in response to urbanization and its relationships with other aspects of landscape patterns have not been adequately discussed in the context of urban regions. Moreover, the significance of spatial distributions and local differences in landscape diversity within urban regions has received minimal attention. To further understand landscape diversity this study conducted a series analysis of landscape metrics to describe the spatiotemporal pattern of landscape diversity within the Taipei metropolitan region between 1971 and 2005. The landscape metrics were also analyzed to present the characteristics of landscape patterns and examine the correlations of metrics. The dynamics of intra-level landscape diversity in response to urbanization and its relationships with other aspects of landscape patterns were revealed by a series of metric analyses. The spatial distributions and local differences of landscape diversity were revealed to identify the areas where landscape diversity significantly changed in Taipei metropolitan region. This study also identified the regular pattern of landscape diversity in response to the process of urbanization and tested the theory of urban growth.
|
| [36] |
|
| [37] |
A review on cholce of optimal scale in remote sensing .
Scale is an important factor in the application of remote sensing which directly influences the effect of analysis. The importance of scale has been recognized by the international organization of remote sensing for more than four decades. In this paper, the concept of the choice of scale in remote sensing is given firstly. Then, some methods about the choice of scale are introduced and the evaluation is discussed. At last, some suggestions about the choice of scale in remote sensing are proposed.
|
| [38] |
Object representations at multiple scales from digital elevation models .https://doi.org/10.1016/j.geomorph.2011.03.003 URL PMID: 21760655 [本文引用: 1] 摘要
This contribution provides an overview and prospects of object representation from DEMs as a function of scale. Relationships between object delineation and classification or regionalization are explored, in the context of differences between general and specific geomorphometry. A review of scales issues in geomorphometry—ranging from scale effects to scale optimization techniques—is followed by an analysis of pros and cons of using cells and objects in DEM analysis. Prospects for coupling multi-scale analysis and object delineation are then discussed. Within this context, we propose discrete geomorphometry as a possible approach between general and specific geomorphometry. Discrete geomorphometry would apply to and describe land-surface divisions defined solely by the criteria of homogeneity in respect to a given land-surface parameter or a combination of several parameters. Homogeneity, in its turn, should always be relative to scale.
|
| [39] |
A novel method for simulating urban population potential based on urban patches: A case study in Jiangsu Province, China .https://doi.org/10.3390/su7043984 URL [本文引用: 1] 摘要
Urban population potential is a good measure of urban spatial interactions. However, previous studies often assigned population data to the administrative point of the government or the centroid of the region, such as the county, ward or village. In these cases, two problems exist: (1) the zone centroid problem and (2) the scale problem. To better deal with these problems, we proposed a novel method for simulating the urban population potential based on urban patches using Jiangsu Province as the study area. This study conducted research on a classification scheme based on area for urban patches and developed an urban population potential model on the basis of a potential model. The spatial simulation of the urban population potential at various urban scales and the comprehensive urban population potential of Jiangsu were determined. The spatial pattern is “southern Jiangsu high and north-central Jiangsu low”, which is consistent with the “pole-axis” spatial system. This study also compared the simulations of the new method and a traditional method. Results revealed that the method based on urban patches was superior in simulating real spatial patterns of the urban population potential. Further improvements should focus on actual conditions, such as passable expressway entrances and exits and railway stations, and high-speed railway data should be employed when simulating the urban population potential across provinces and greater China.
|
| [40] |
Spatial distribution of statistical population based on boundary-substitution .https://doi.org/10.3969/j.issn.1560-8999.2005.04.013 URL Magsci [本文引用: 1] 摘要
首先将山东省各县市按级别分类,利用回归方法得到不同级别县市的城镇居住密度与农村居住密度,然后根据乡镇驻地位置,构造Voronoi图来替代乡镇边界。在此基础上利用各乡镇人口数据与居民点数据计算得到各 Voronoi图形的居住密度,并将该密度赋予每个图形的发生点(即乡镇驻地位置),而后利用反距离插值算法,并结合窗口移动平均处理,得到全省的居住密度分布图。使用居住密度分布图和居民点分布数据,计算人口分布数据。并根据每个县市的图上汇总人口和统计人口,计算得到各县市的调整系数,使用该系数对每个栅格的人口数进行调整,保证了各县市总人口不会出现误差。最终得到山东省1km×1km栅格的人口分布数据。最后选取某些样本县, 在样本县内对比每个乡镇图上的人口与实际统计人口,结果表明该人口分布数据有较高的精度。
基于边界替代的人口数据空间化方法研究 .https://doi.org/10.3969/j.issn.1560-8999.2005.04.013 URL Magsci [本文引用: 1] 摘要
首先将山东省各县市按级别分类,利用回归方法得到不同级别县市的城镇居住密度与农村居住密度,然后根据乡镇驻地位置,构造Voronoi图来替代乡镇边界。在此基础上利用各乡镇人口数据与居民点数据计算得到各 Voronoi图形的居住密度,并将该密度赋予每个图形的发生点(即乡镇驻地位置),而后利用反距离插值算法,并结合窗口移动平均处理,得到全省的居住密度分布图。使用居住密度分布图和居民点分布数据,计算人口分布数据。并根据每个县市的图上汇总人口和统计人口,计算得到各县市的调整系数,使用该系数对每个栅格的人口数进行调整,保证了各县市总人口不会出现误差。最终得到山东省1km×1km栅格的人口分布数据。最后选取某些样本县, 在样本县内对比每个乡镇图上的人口与实际统计人口,结果表明该人口分布数据有较高的精度。
|
| [41] |
Study the fundamentals of detecting spatial pattern in remote sensing images by comparing average local variance with semi-variograms [D].局部方差与变异函数方法对比的遥感影像空间格局探测机制研究[D]: 北京 . |
| [42] |
Multi-scale landform characterization . |
| [43] |
Review on scale-related researches in grid-based digital terrain analysis .https://doi.org/10.11821/dlyj201402007 URL [本文引用: 1] 摘要
栅格数字高程模型(DEM)固有的尺度特征给以栅格DEM为基本输入的数字地形分析带来各种尺度问题。对栅格数字地形分析中涉及的尺度进行梳理,以分辨率和分析窗口为重点,对栅格数字地形分析中的多尺度表达、尺度效应、适宜尺度选择、尺度转换等尺度问题及其相互关系进行阐述;分别介绍各类尺度问题的现有定量研究方法,尤其对尺度效应定量刻画和适宜尺度选择方法,根据不同方法计算定量指标所利用的信息类别进行分类归纳;最后讨论了其中有待进一步开展研究的几方面工作。
栅格数字地形分析中的尺度问题研究方法 .https://doi.org/10.11821/dlyj201402007 URL [本文引用: 1] 摘要
栅格数字高程模型(DEM)固有的尺度特征给以栅格DEM为基本输入的数字地形分析带来各种尺度问题。对栅格数字地形分析中涉及的尺度进行梳理,以分辨率和分析窗口为重点,对栅格数字地形分析中的多尺度表达、尺度效应、适宜尺度选择、尺度转换等尺度问题及其相互关系进行阐述;分别介绍各类尺度问题的现有定量研究方法,尤其对尺度效应定量刻画和适宜尺度选择方法,根据不同方法计算定量指标所利用的信息类别进行分类归纳;最后讨论了其中有待进一步开展研究的几方面工作。
|

/
| 〈 |
|
〉 |


