陈卓 , 金凤君, 王伟
CHEN Zhuo, WANG Wei
通讯作者:
收稿日期: 2017-09-25
修回日期: 2018-07-31
网络出版日期: 2018-09-04
版权声明: 2018 地理科学进展 《地理科学进展》杂志 版权所有
基金资助:
作者简介:
作者简介:陈卓(1991-),男,河南安阳人,博士研究生,主要研究方向为交通运输地理,E-mail: chenz.16b@igsnrr.ac.cn。
展开
摘要
交通流是社会经济空间联系的直观反映,其距离衰减规律对空间秩序的形成与演化意义重大。利用2016年10月份的福建省高速公路收费站数据,以县区为基本单位,识别高速公路流O-D矩阵;在此基础上,利用空模型法模拟省和县区2个尺度上高速公路流的距离衰减规律,并结合空间分析和相关分析法,探讨高速公路流距离衰减规律的空间分异特征与规律。结果显示,①高速公路流主要集中在0~200 km与0~200 min区段,较好地契合了公路运输的经济半径与交通流的时空断裂特征;②省域层面上,高速公路流随距离的增加有显著的衰减趋势,当采用路网距离、幂律型衰减函数时,距离衰减系数为2.674,显著高于常规所选数值2;③不同县区高速公路流的距离衰减速度在空间上呈显著的圈层模式,与高速公路流的空间分布形成较好的耦合关系;④距离衰减规律内生于社会经济空间联系格局,不仅影响空间秩序的形成与演化,也会受空间秩序演化的影响,一定条件下,节点的对外社会经济空间联系强度会随节点规模、人口与经济密度的提高以及区位条件的优化形成自我加速的反馈过程,形成循环累积效应。
关键词:
Abstract
As the basic law of geography, the law of distance-decay is of great significance to the formation and evolution of spatial order. Using the data of Fujian expressway toll stations in October 2016, an expressway flow origin-destination matrix was identified with county areas as the basic unit. Cumulative proportion curve, spectrum analysis, and null model were used to simulate the distance-decay effect of expressway flow on the provincial and county scales. Then, combining spatial analysis and correlation analysis, the spatial differentiation characteristics and the distance-decay effect of expressway flow were discussed. The results show that: (1) The expressway flow is mainly concentrated in the 0~200 km and 0~200 min sections, which is in line with the economic radius of road transportation and the temporal and spatial fracture characteristics of traffic flow. (2) The expressway flow has a significant decreasing tendency on the provincial scale with the increase of distance. When using the road distance and power-law decay function, the distance decay coefficient is 2.674, which is significantly higher than the conventional value of 2. (3) The distance-decay rates of the expressway flow in different counties show a clear zonal pattern, corresponding well with the spatial distribution of expressway flow. (4) The law of distance-decay not only influences the evolution of spatial order, but also is influenced by the evolution of spatial order, and it is endogenous to the spatial patterns of socioeconomic activities. Under certain conditions, the strength of socioeconomic spatial connections will form a self accelerating feedback process with the increase of node size, population, and economic density, and the optimization of location conditions.
Keywords:
距离是基础的地理概念之一,甚至有学者称地理学为“一门距离的学科”(Watson, 1955)。随着距离的增长,地理要素间的交互作用强度趋弱,这种现象称为距离衰减。长期以来,聚焦空间秩序,发现空间分布和作用的法则与模式是地理学研究的经典传统(Johnston, 1975),距离衰减作为影响空间秩序形成与演化的基础法则,也因此成为构筑地理学大厦的重要基石之一。
距离衰减是自然界与人类社会绝大多数运动所遵循的基本规律,具有多样的表现形式与数学表达。在经济地理学领域,早期研究中,由利润最大化衍生而来的距离最小化假设是距离衰减规律的重要体现(Isard, 1960);20世纪以来,随着牛顿模型在社会科学的广泛应用与威尔逊模型的建立(Ravenstein, 1889; Wilson, 1967),距离衰减规律的数学表达逐渐走向成熟,特定社会经济空间联系的距离衰减规律模拟成为研究热点。在宏观层面上,人口迁移、交通流和旅游流的距离衰减规律首先得到学者关注(Ullman, 1956; Cliff et al, 1974; 王成金, 2009; 李山等, 2012);随着大数据时代的到来,基于手机数据、社交网络数据、网页数据的研究大量涌现(Hawelka et al, 2014; Liu et al, 2014; Jurdak et al, 2015)。在微观层面上,时空间行为研究技术的成熟,使基于时空轨迹数据研究社会个体出行活动的距离衰减规律成为可能,社会个体移动到不同目的地的概率与距离的关系成为相关研究的前沿(Liu et al, 2012; 王静远等, 2014; Lin et al, 2015)。纵观现有研究,不同目的、形式和内容的社会经济空间联系所契合的距离衰减函数模式及其参数估计是核心内容,但对距离衰减规律的反思却较少涉及。对同一类型的社会经济空间联系而言,距离衰减速度是恒值么?如果不是,距离衰减速度的空间分异具有何种特征与规律?对社会经济空间组织的启示有哪些?罗恩·约翰斯顿指出,距离与运动间关系的多样性对正确理解空间秩序具有重要意义(Johnston, 2003),部分学者也指出引力模型参数具有时空分异的特征(Daniel, 2007; Dai et al, 2008; 郑清菁等, 2014),但却未针对上述问题进行系统地 解答。
交通流是社会经济空间联系的直观反映,基于交通流数据模拟社会经济空间联系的距离衰减规律具有典型性与代表性。同时,随着近年来数据收集与分析技术的发展,大量可获取的交通数据呈井喷状态,为交通流的距离衰减规律模拟提供了良好基础。本文基于福建省高速公路收费站数据开展实证研究,在模拟高速公路流的距离衰减规律的基础上,分析高速公路流距离衰减的空间分异特征与规律,以期透视距离衰减规律背后隐藏的地理事实,为社会经济空间组织提供有益借鉴。
研究所需数据包括高速公路流O-D矩阵与距离矩阵。其中,高速公路流O-D矩阵通过对福建省高速公路收费站数据进行处理获得。原始数据获取自交通运输部科学研究院,时间区段为2016年10月12-22日,共计318个收费站、7818347条记录,剔除554624条省际公路流记录,共计7263723条省内有效记录。结合Oracle数据库与PL/SQL软件,对原始数据进行分组求和,获取各县区之间的高速公路流O-D矩阵(图1)。需要指出的是:①考虑到各地市中心城区各辖区的整体性以及高速公路收费站主要布局在环城公路沿线的特征,对中心城区各辖区处理进行合并,研究区域共计67个统计单位。②高速公路流具有显著的周期性(7天)且受国家法定节假日的影响较大,因此数据选取时段应至少覆盖一个完整的周期,并避开国家法定节假日。同时,考虑到存在一定比例的跨日出行,研究选取2016年10月12-22日的高速公路收费站数据,以确保覆盖一个完整的周期,最大程度地反映节点间的真实联系。③由于中国高速公路实行以省划界、分省收费的管理体制,省际数据需要借助省外收费站的车辆采集数据,导致省际O-D的精确属性难以获取,为此研究聚焦于省内高速交通流的发生和组织。从统计数据来看,省内高速公路流占总量的92.91%,能较好反映福建省高速公路流的主要衰减特征。
图1 福建省高速公路路网与流量的空间分布
Fig.1 Spatial distribution of expressway network and flows in Fujian Province
在距离形式与算法的选取上,从克服空间阻力的视角来看,距离作为运动的约束条件具有可塑性(金凤君, 2001),欧氏距离、曼哈顿距离、路网距离、时间距离、成本距离等不同形式与算法的距离对运动的约束不一。就交通运输而言,路网距离、时间距离与成本距离是居民出行与货物运输的重要影响因子。其中,成本距离与车型、载重等因素紧密相关,难以进行准确估计,故重点分析高速公路流随路网距离与时间距离的衰减规律。对距离矩阵的获取,现有研究多基于ArcGIS利用网络分析法获取。考虑到福建省的地形、地貌复杂多样,导致不同技术等级线路的限速情况多变,为保证数据的精确性,距离矩阵利用网络爬虫获取自百度地图。
2.2.1 距离衰减函数
距离与运动的多个方面存在联系,二者之间的关系并不唯一,可能表现为幂函数、指数函数或者其他的形式(Taylor, 1971)。由于无法获取有效的关于高速公路流距离衰减模式的先验判断,以常见距离衰减函数依次拟合现有数据,根据统计检验指标判断高速公路流的距离衰减模式(表1)。
表1 常见距离衰减函数形式
Tab.1 Common forms of distance-decay functions
| 模式 | 函数 |
|---|---|
| 指数型 | |
| 幂律型 | |
| 高斯型 | |
| 指数截断幂律型 | |
| 对数正态型 | |
| 平方指数型 | |
| 平方根指数型 |
2.2.2 空模型法
距离衰减函数的估算方法众多,包括空模型法、线性回归法、线性规划法、粒子群优化算法、蒙特卡罗法等(刘瑜等, 2014)。其中,空模型法的基本思想是通过剔除O-D流矩阵中质量因子的影响,获取距离效应矩阵,进而结合距离矩阵模拟距离衰减规律。与其他方法相比,空模型法有利于过滤质量因子对距离衰减参数的潜在影响,使研究聚焦于距离衰减参数,更好地模拟社会经济联系随距离的衰减过程。
具体而言,首先,在空间联系强度与节点质量成正比的假设下,构建一个与距离无关的空间联系矩阵
式中:
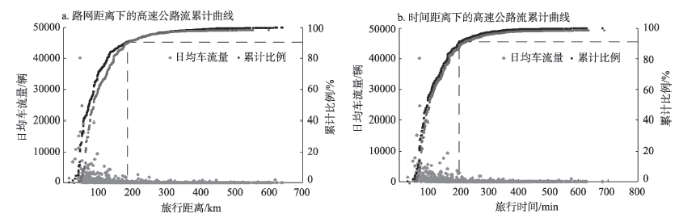
累计比例曲线是交通流随距离分布的重要表现形式,能直观地表达出流量主要集中在哪些距离区段。以累计比例90%为界,福建省高速公路流主要集中在0~180.24 km与0~197.77 min区段(图2)。从交通方式的技术经济特性来看,一般认为公路运输的经济半径在0~200 km(沈志云等, 2012),高速公路流随路网距离的分布较好地契合了该规律; 从交通流的时空断裂特征来看,由于食宿成本与时间成本的存在,交通联系强度一般会在3 h时间距离处发生跳跃(陈卓等, 2016),与高速公路流随旅行时间的分布大体相符。
高速公路流累计比例曲线的一个有益启示是高速公路交通圈的建设,路网距离上限宜控制在200 km左右,时间距离上限宜控制在3 h左右。直观上,3 h对应的高速公路路网距离应在300~350 km,但在考虑中心城区交通时间的前提下,中心城市3 h交通圈所对应的路网距离仅为200 km左右,与将中心城区作为点的研究形成强烈的对比。相反,在不考虑中心城区交通时间的情形下,可发现高速交通流主要集中在中心城区2 h交通圈内(图3),与路网距离(200 km)较好地对应起来。该结论也从侧面反映了城市交通对区域发展可能带来的影响,即限制中心城市对周边区域的辐射能力。就福建省而言,考虑城市内部交通与不考虑城市内部交通2种情形下,中心城市的空间辐射范围大约存在1 h左右的时距差异。
图3 不考虑中心城市交通的情况下高速公路流与中心城市可达性的空间耦合
Fig.3 Spatial coupling of expressway flow and central city accessibility without considering urban traffic
利用空模型法,获取距离效应矩阵(图4)。理论上,如果高速公路流符合一定的距离衰减模式,距离效应图谱的分布与距离图谱的分布应该呈特定的数量关系。一方面,从对角线向两侧看,距离效应图谱整体呈由高到低的格局,与距离图谱大体一致,说明高速公路流随距离的增加有显著的衰减趋势;另一方面,对角线周边出现部分距离效应较低的斑点,右上方与左下方区域出现部分距离较长而距离效应较高的斑点,形成较为显著的干扰,在一定程度上反映了高速公路距离衰减规律的复杂性。
考虑到高速公路流是复杂的集合体,涵盖了不同性质主体的众多目的、内容、形式不一的出行与运输,不同类别的出行与运输对距离的敏感程度不一,可能呈现出不同的距离衰减模式。如相对于低收入家庭,高收入家庭对距离的敏感度较低;相对于访亲,商务出行与就医等活动对距离的敏感度较低。此外,作为多变量交织的复杂巨系统,社会经济系统内部不同变量之间存在各样的影响与制约关系,距离与运动的关系亦会受到其他相关变量的影响;同时,作为行为主体的人具有主观能动性,导致不同变量间的关系具有较高的不确定性,距离与运动的关系也不例外。因此,分别基于路网距离与时间距离,采用不同模式的距离衰减函数模拟高速公路流的距离衰减规律(表2)。
表2 距离衰减函数模拟
Tab.2 Simulations of different distance-decay functions
| 距离类型 | 衰减函数模式 | β/α | R2 | 函数 |
|---|---|---|---|---|
| 路网距离 | 幂律型 | 2.674* | 0.642 | |
| 指数型 | 0.010* | 0.580 | ||
| 高斯型 | 5.25E-05* | 0.644 | ||
| 指数截断幂律型 | 3.206*/-0.002* | 0.644 | ||
| 对数正态型 | 0.253* | 0.638 | ||
| 平方指数型 | 1.54E-05* | 0.479 | ||
| 平方根指数型 | 0.361* | 0.622 | ||
| 时间距离 | 幂律型 | 3.001* | 0.619 | |
| 指数型 | 0.011* | 0.565 | ||
| 高斯型 | 5.37E-05* | 0.625 | ||
| 指数截断幂律型 | 3.784*/-0.003* | 0.621 | ||
| 对数正态型 | 0.279* | 0.615 | ||
| 平方指数型 | 1.6E-05* | 0.476 | ||
| 平方根指数型 | 0.388* | 0.601 |
结果显示,福建省高速公路流存在显著的距离衰减特征,各项拟合函数的系数均在1%水平上显著,且基于路网距离的衰减系数均小于基于时间距离的衰减系数,表明高速公路流对时间距离的变化更为敏感。在距离衰减模式上,幂律型、高斯型、指数截断幂律型、对数正态型衰减函数的拟合优度相近,略高于其他模式的衰减函数。考虑到现有研究多基于幂律型衰减函数与指数型衰减函数展开,其他模式的衰减函数模型结构与参数范围的意义尚未得到有效考证(陈彦光, 2009)。同时,幂律型衰减函数的拟合优度优于指数型衰减函数,即高速公路流反映了较大尺度上的复杂空间交互系统与一定比例的长程空间相互作用,因此采用幂律型衰减函数的拟合结果。在距离衰减速度上,福建省高速公路流的总体距离衰减系数为2.674,与其他形式的交通流相比,航空流在0.2~0.8之间(Yu et al, 2013),铁路流在0.7~1.5之间(戴特奇等, 2005; 王成金, 2009),整体上呈现航空流<铁路流<公路流的特征,表明不同交通方式对距离的敏感性不同。民航作为长距离运输方式,对距离的敏感性最低;公路作为中短距离运输方式,对距离的敏感性最高,与其技术经济特性相符。同时,该结论也说明不同类型的交通流所反映的空间相互作用尺度不同,实际研究中,公路流较适宜分析中小尺度上的城镇体系以及中心城市对周边区域的辐射吸引效应,铁路流与航空流则更适宜区域、国家尺度上的城市体系与社会经济空间联系网络研究。
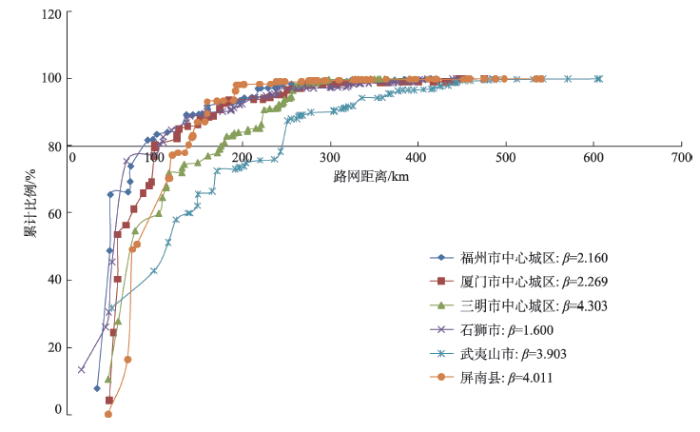
选取福州市中心城区、厦门市中心城区、三明市中心城区、石狮市、武夷山市与屏南县等6个典型节点,对比其高速公路流的累计比例曲线与距离衰减速度(图5)。其中,福州市中心城区与厦门市中心城区属于省域层面上的综合型中心节点,三明市中心城区为市域层面上的综合型中心节点,石狮市为经济职能显著的专业型节点,武夷山市为典型的旅游城市,屏南县为典型的内陆小规模县区。
以累计比例80%为界,不同节点的累计比例曲线呈现出不同的特征。当累计比例小于80%时,累计速度为:福州市中心城区>厦门市中心城区>石狮市>屏南县>三明市中心城区>武夷山市,与距离衰减速度大致呈反比。其中,福州市中心城区、厦门市中心城区和石狮市在100 km以内的少数几个方向上,累计比例迅速达到80%,屏南县与三明市中心城区在100~200 km间累计比例达到80%,武夷山市则在250 km左右累计比例达到80%。当累计比例大于80%时,累计速度为:屏南县>三明市中心城区>武夷山市>福州市中心城区>厦门市中心城区>石狮市,与距离衰减速度大致呈正比。累计比例自80%上升至99%,石狮市与厦门市中心城区的路网距离延伸了约280 km,福州市中心城区与武夷山市的路网距离延伸了约200 km,屏南县与三明市中心城区的路网距离延伸仅约100 km。
节点高速公路流的空间分布与其主要社会经济活动类型紧密相关。与三明市中心城区、武夷山市和屏南县相比,福州市中心城区、厦门市中心城区和石狮市等具备高级职能的节点高速公路流的距离衰减速度较低,并呈现短程集中、长程相对均匀的空间格局。一方面,福州市中心城区、厦门市中心城区和石狮市作为省域社会经济发展的重要节点,具有服务全省的高级职能,使其高速公路流在长程依然能保持一定的强度;另一方面,集聚经济和距离门槛的存在,使其高速公路流在短程的少数方向上高度集聚。相较而言,三明市中心城区与屏南县空间辐射范围小、集聚效应不显著,引致其高速公路流在中短距离内迅速衰减。武夷山市作为典型的旅游城市,其高速公路流的空间分布受旅游出行特征影响,空间辐射范围较大,但在250 km以外,距离衰减速度显著加快。
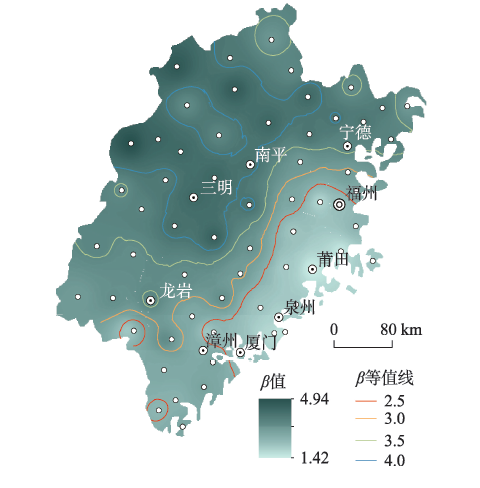
根据福建省特定县区节点的对外高速公路流记录,基于幂律型衰减函数测算其高速公路流的距离衰减速度(图6)。结果显示,各县区距离衰减速度呈现出显著的空间分异,并与社会经济空间联系格局形成较好的耦合关系。第一,各县区高速公路流的距离衰减系数分布在1.42~4.94之间,并呈现出显著的圈层模式。其中,低距离衰减系数的县区主要分布在沿海福州市至厦门市一线,以该区域为核心,距离衰减系数向外呈逐渐递增,并呈现出沿海低于内陆、闽南低于闽北的总体格局。第二,高速公路流距离衰减速度的空间分异与其空间分布格局形成了较好的耦合关系。距离衰减系数较高的福州、莆田、泉州、厦门四市高速公路日均车流量合计为437898 辆,占省域总量的66.31%;其中四市内部各县区的高速公路日均车流量383168辆,占省域总量的58.03%,是福建省高速公路流最密集的区域。与之相对比,距离衰减系数较高的三明、南平和宁德三市的日均高速车流量合计为109989辆,仅占省域总量的16.66%。
高速公路流距离衰减规律的空间分异对社会经济空间组织具有重要的启示意义。从社会经济资源空间配置的视角来看,低距离衰减速度的节点易与周边地区形成紧密的社会经济联系,吸引要素集聚,辐射带动周边区域的发展。就福建省而言,厦门、泉州、莆田、福州四市高速公路流的距离衰减速度低,空间辐射范围广,是省域社会经济发展的核心区;三明市和南平市高速公路流的距离衰减速度高,空间辐射范围小,是省域社会经济发展的边缘区。从国土开发与利用格局来看,闽北地区高速公路流的距离衰减速度显著高于闽南地区,不易接受中心城市的辐射吸引,未来应强化提升中心城市对闽北内陆地区的带动能力。
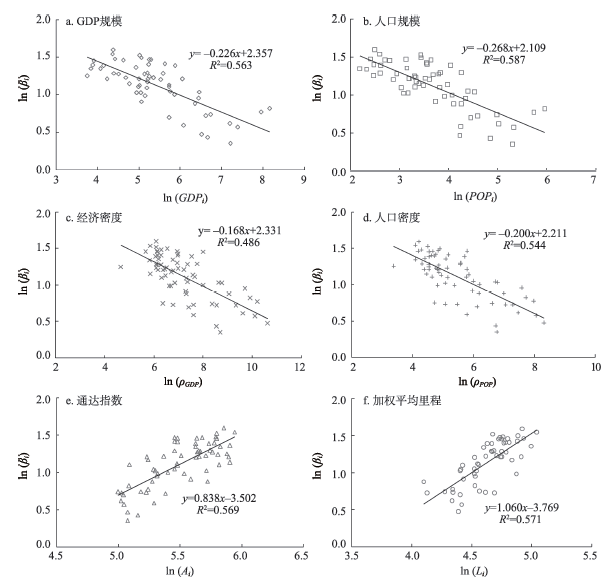
作为区域社会经济空间联系格局形成、发展与演化所遵循的基本法则,距离衰减规律与区域空间结构的关系密切。考察各县区高速公路流的距离衰减速度与区域空间结构重要表征指标之间的关系可以发现(图7),在对数坐标下,距离衰减系数与各县区的GDP规模、人口规模、GDP密度、人口密度的皮尔逊相关系数分别为-0.750、-0.766、-0.697、 -0.738,表现为显著的线性负相关;与通达性指数、加权平均里程的皮尔逊相关系数分别为0.754、0.756,表现为显著的线性正相关。
图7 距离衰减系数与空间结构指标的关系
Fig.7 Relationship between distance-decay coefficient and the typical indexes of spatial structure
进一步地,分别以GDP规模与人口规模的几何平均值、经济密度与人口密度的几何平均值、通达指数与加权平均里程的几何平均值为规模(Scale)、密度(Density)、区位条件(Location)的表征指标,利用统计计量模型分析各县区高速公路流的距离衰减速度与区域空间结构表征指标的因果关系(表3)。结果显示,规模指标与密度指标的回归系数显著为正,区位指标的回归系数显著为负。由于通达指数与加权平均里程均为反向指标,即指标数值越小,区位条件越好,因此该结果表明节点的规模越大、人口与经济密度越高、区位条件越好,高速公路流的距离衰减速度越小;反之,距离衰减速度越高。
表3 高速公路流距离衰减速度与区域空间结构表征指标之间的统计计量关系
Tab.3 Statistical relationship between distance-decay coefficient and the typical indexes of spatial structure
| N=67 | 规模 | 密度 | 区位 | R2 | F统计量 |
|---|---|---|---|---|---|
| 系数(Coefficients) | -0.048 | -0.113 | 0.266 | 0.575 | 27.09 |
| P-value | 0.037 | 0.015 | 0.041 |
上述结果表明,第一,区域空间结构对高速公路流的距离衰减规律具有重要影响。一方面,区域空间结构在一定程度上决定交通建设与组织的空间布局,进而导致不同方向上时空收敛的速度存在差异。节点在交通建设与组织中的地位越高,克服空间阻隔的能力越强,高速公路流的距离衰减速度越小。另一方面,区域空间结构决定了社会经济空间联系格局,节点在区域社会经济空间联系格局中的地位越重要、空间交流需求越大,对距离的敏感性越低,高速公路流的距离衰减速度越小。
第二,距离衰减规律内生于社会经济空间联系格局。高速公路流距离衰减函数的拟合参数在空间上是变化的,且其变化与节点的规模、人口与经济密度以及区位条件显著相关,表现为特定的空间模式。这表明距离衰减规律是内生的,运动与距离间的关系不仅影响社会经济空间联系格局,反过来,社会经济空间联系格局也影响运动与距离间的关系。根据高速公路流距离衰减规律与节点规模、人口与经济密度以及区位条件的相关性,传统将距离衰减系数视为外生变量的做法(采用幂律型衰减函数时,一般为2),有低估大规模、高密度、优区位节点的对外联系和高估小规模、低密度、劣区位节点的对外联系的倾向。
第三,社会经济空间联系具有循环累积效应。高速公路流的距离衰减速度与节点规模呈负相关,则节点规模的扩大,不仅会提高节点质量,也会降低距离衰减速度,导致以该节点为起终点的高速公路流强度加速提升,并反过来促进节点规模的持续扩大。类似地,高速公路流的距离衰减速度与区位条件呈负相关,则区位条件的改善,不仅会改善节点与周边地区的通达性,也会降低距离衰减速度,使得以该节点为起终点的高速公路流强度加速提升,并反过来促进节点区位的持续优化。故此,在一定条件下,节点的对外经济社会空间联系强度会随节点规模的提高、区位条件的改善形成自我加速的反馈效应。
长期以来,距离衰减规律作为影响空间秩序形成与演化的基础法则,是地理学研究的经典问题。本文基于福建省高速公路收费站数据,利用空模型法,分别在省域与县区2个空间尺度模拟高速公路流的距离衰减规律,并结合空间分析和相关分析法,探讨了高速公路流距离衰减规律空间分异的特征与规律。
(1) 福建省高速公路流主要集中在0~200 km与0~200 min区段,较好地契合了公路运输的经济半径与交通流的时空断裂特征。据此,高速公路交通圈的建设,路网距离上限宜控制在200 km左右,时间距离上限宜控制在3 h左右。
(2) 省域层面上,高速公路流随距离的增加有显著的衰减趋势,且随时间距离衰减的速度快于随路网距离衰减的速度;同时,幂律型、高斯型、指数截断幂律型、对数正态型衰减函数的拟合优度相近,表明高速公路流的距离衰减模式并不明显。当采用路网距离、幂律型衰减函数时,距离衰减系数为2.674,显著高于常规所选数值2。
(3) 各节点高速公路流的空间分布与其主要的社会经济活动类型紧密相关,福州市中心城区、厦门市中心城区和石狮市等具备高级职能的节点,其对外高速公路流呈短程集中、长程相对均匀的空间格局;三明市中心城区与屏南县的高速公路流则在中短距离内迅速衰减;武夷山市作为典型的旅游城市,高速公路流的衰减速度在250 km以外显著加快。
(4) 不同县区高速公路流的距离衰减速度在空间上呈显著的圈层模式,与高速公路流的空间分布形成较好的耦合关系。其中,低距离衰减系数的县区主要分布在福建沿海的福州市至厦门市一线,以该区域为核心,距离衰减系数向外呈逐渐递增,并呈现出沿海低于内陆、闽南低于闽北的总体格局。
(5) 高速公路流的距离衰减规律与节点规模、人口与经济密度以及区位条件密切相关,距离衰减速度与城市规模、人口与经济密度以及空间可达性等指标在对数坐标下呈显著的线性关系,不仅证实了区域空间结构对高速公路流的距离衰减规律具有重要影响,也表明高速公路流的距离衰减规律内生于社会经济空间联系格局,不仅影响空间秩序的形成与演化,也会受空间秩序演化的影响。同时,在一定条件下,节点的对外高速公路流强度会随节点规模、人口与经济密度的提高以及区位条件的优化形成自我加速的反馈过程,形成循环累积效应。
从系统论的角度来看,区域属于多变量交织的复杂巨系统,不同变量之间相互影响、相互制约,距离作为其中的基础变量亦不例外,距离衰减规律必然受到其他因素的影响与制约,内生于社会经济空间联系格局。受益于简单明了、易于理解与操作的模型结构,以牛顿模型和威尔逊模型为主力的引力模型在简化、理解社会经济空间联系格局和空间秩序方面广受青睐,是辨明空间模式、关系和趋势的重要工具。但是,引力模型将距离衰减规律视为外生的做法,会在一定程度上导致空间模拟的失真,判定这种失真的程度及其对实践应用的影响,并提出修正方法,对空间相互作用关系进行重新模型化,是一项极具意义的研究工作。同时,在承认距离衰减规律内生于社会经济空间联系格局的前提下,如何从距离衰减规律空间分异的视角科学地理解空间秩序,提高空间组织的效率与效益,仍需要进一步的探索。
The authors have declared that no competing interests exist.
| [1] |
空间相互作用模型的形式、量纲和局域性问题探讨 [J].On the mathematical form, dimension, and locality of the spatial interaction model [J]. |
| [2] |
北京市等时间交通圈的范围、形态与结构特征 [J].Scope, shape, and structural characteristics of traffic circles of equal travel time in Beijing [J]. |
| [3] |
空间相互作用与城市关联网络演进: 以我国20世纪90年代城际铁路客流为例 [J].Spatial interaction and network structure evolvement of cities in term of China's railway passenger flow in 1990s [J]. |
| [4] |
基础设施与人类生存环境之关系研究 [J].https://doi.org/10.11820/dlkxjz.2001.03.011 URL [本文引用: 1] 摘要
Infrastructure is a system which supports the activity of human beings. In order to improve their living environment, human beings always expend huge capital to construct infrastructure. Without doubt, infrastructure has been playing important roles in improving human living conditions, and human activity more and more depends on infrastructure and infrastructure service. However, there is little research to appraise the influence of infrastructure to human activity. In this paper, the relations between infrastructure and human living environment are studied systematically. The paper points out that the roles of infrastructure in improving human living environment concentrate in three aspects: firstly, as a basic condition, infrastructure supports the expansion of living space. Due to the development of modern infrastructure, personal daily activity space has been expanded over 20 times. The travel time from Beijing to Shanghai, for instance, has been reduced to less 2 hours by air at present from 150 hours in the middle of nineteen century. Infrastructure leads to rational and efficient utility of living space and changes the concepts of relation between time and space of human beings. Secondly, infrastructure promotes the share of resources around the world. Statistics show that there are several billion tons of goods exchanged among countries due to the support of railway and maritime infrastructure. Infrastructure has increased human capacity and promoted efficiency in resources sharing. Thirdly, infrastructure has roles to optimize living environment. A lot of non productive infrastructures have been given more important attention to improve natural environment.
Infrastructure and the living environment of human being [J].https://doi.org/10.11820/dlkxjz.2001.03.011 URL [本文引用: 1] 摘要
Infrastructure is a system which supports the activity of human beings. In order to improve their living environment, human beings always expend huge capital to construct infrastructure. Without doubt, infrastructure has been playing important roles in improving human living conditions, and human activity more and more depends on infrastructure and infrastructure service. However, there is little research to appraise the influence of infrastructure to human activity. In this paper, the relations between infrastructure and human living environment are studied systematically. The paper points out that the roles of infrastructure in improving human living environment concentrate in three aspects: firstly, as a basic condition, infrastructure supports the expansion of living space. Due to the development of modern infrastructure, personal daily activity space has been expanded over 20 times. The travel time from Beijing to Shanghai, for instance, has been reduced to less 2 hours by air at present from 150 hours in the middle of nineteen century. Infrastructure leads to rational and efficient utility of living space and changes the concepts of relation between time and space of human beings. Secondly, infrastructure promotes the share of resources around the world. Statistics show that there are several billion tons of goods exchanged among countries due to the support of railway and maritime infrastructure. Infrastructure has increased human capacity and promoted efficiency in resources sharing. Thirdly, infrastructure has roles to optimize living environment. A lot of non productive infrastructures have been given more important attention to improve natural environment.
|
| [5] |
旅游空间相互作用的引力模型及其应用 [J].https://doi.org/10.11821/xb201204009 URL [本文引用: 1] 摘要
客源地与目的地之间的旅游空间相互作用是必然而持久地,这深刻地影响着旅游者行为和旅游业进步,需要发展适宜的引力模型对其进行刻画和量度.长期以来,旅游引力模型在对空间阻尼的处理上类比牛顿型的幂函数衰减模式,难以克服一些固有缺陷,因此重新回到威尔逊型的指数函数衰减模式就成为一种可能选择.本文即是基于威尔逊形式,将目的地“吸引力”、客源地“出游力”和两地间的“空间阻尼”作为3个基本解释变量类型,构建了一个基础的旅游引力模型,并重点在参数估计和模型应用上进行了初步探索.由于难以从整体上对模型的两个核心参数进行回归估计,本文首先从局部对收入弹性系数α进行回归估计,然后通过“口粒子模式法”和“出游量积分法”的引入和交互验证来确定空间阻尼系数β的合理取值.研究表明,就全国平均而言,在21世纪初收入弹性系数可取0.64,而空间阻尼系数可取0.00322,且在空间阻尼影响下,中国大陆居民国内旅游的理论出游半径均值约为300km.最后,本文从目的地供给视角计算了中国大陆分省区的旅游吸引力,从客源地需求视角计算了成都市到访游客的分省预期市场份额,这两个案例研究在取得一些有益发现的同时也表明威尔逊型旅游引力模型具有积极的应用潜力,值得进一步探索.
Gravity model for tourism spatial interaction: Basic form, parameter estimation, and applications [J].https://doi.org/10.11821/xb201204009 URL [本文引用: 1] 摘要
客源地与目的地之间的旅游空间相互作用是必然而持久地,这深刻地影响着旅游者行为和旅游业进步,需要发展适宜的引力模型对其进行刻画和量度.长期以来,旅游引力模型在对空间阻尼的处理上类比牛顿型的幂函数衰减模式,难以克服一些固有缺陷,因此重新回到威尔逊型的指数函数衰减模式就成为一种可能选择.本文即是基于威尔逊形式,将目的地“吸引力”、客源地“出游力”和两地间的“空间阻尼”作为3个基本解释变量类型,构建了一个基础的旅游引力模型,并重点在参数估计和模型应用上进行了初步探索.由于难以从整体上对模型的两个核心参数进行回归估计,本文首先从局部对收入弹性系数α进行回归估计,然后通过“口粒子模式法”和“出游量积分法”的引入和交互验证来确定空间阻尼系数β的合理取值.研究表明,就全国平均而言,在21世纪初收入弹性系数可取0.64,而空间阻尼系数可取0.00322,且在空间阻尼影响下,中国大陆居民国内旅游的理论出游半径均值约为300km.最后,本文从目的地供给视角计算了中国大陆分省区的旅游吸引力,从客源地需求视角计算了成都市到访游客的分省预期市场份额,这两个案例研究在取得一些有益发现的同时也表明威尔逊型旅游引力模型具有积极的应用潜力,值得进一步探索.
|
| [6] |
空间交互作用中的距离影响及定量分析 [J].https://doi.org/10.13209/j.0479-8023.2014.051 URL [本文引用: 2] 摘要
Distance decay issue of spatial interactions in geography was described and analyzed, and a number of approaches were summarized to solve the gravity model. Firstly, many spatial interactions are governed by the distance decay effect, and the distance decay function quantitatively represents the distance effect. Among kinds of distance decay functions such as power law, exponential and other equations, the power law function reveals the inherent distance impacts behind spatial interactions so that the interaction formula becomes the gravity model, which is widely used in geography and regional economics. Secondly, the authors summarize some methods to quantify the distance decay function according to an interaction matrix and a distance matrix. The simulation results show that fitting the gravity model to estimate nodal attractions as well as the distance decay parameter is an appropriate way to apply the model.
Quantifying the distance effect in spatial interactions [J].https://doi.org/10.13209/j.0479-8023.2014.051 URL [本文引用: 2] 摘要
Distance decay issue of spatial interactions in geography was described and analyzed, and a number of approaches were summarized to solve the gravity model. Firstly, many spatial interactions are governed by the distance decay effect, and the distance decay function quantitatively represents the distance effect. Among kinds of distance decay functions such as power law, exponential and other equations, the power law function reveals the inherent distance impacts behind spatial interactions so that the interaction formula becomes the gravity model, which is widely used in geography and regional economics. Secondly, the authors summarize some methods to quantify the distance decay function according to an interaction matrix and a distance matrix. The simulation results show that fitting the gravity model to estimate nodal attractions as well as the distance decay parameter is an appropriate way to apply the model.
|
| [7] |
|
| [8] |
中国交通流的衰减函数模拟及特征 [J].Function simulation and regularity of distance decay of inter-urban traffic flow in China [J]. |
| [9] |
以数据为中心的智慧城市研究综述 [J].Survey of data-centric smart city [J]. |
| [10] |
重力模型参数空间差异研究: 以中国城市间铁路客流为例 [J].https://doi.org/10.11820/dlkxjz.2014.12.009 URL [本文引用: 1] 摘要
重力模型是重要的空间相互作用模型,已经在相关研究和实践中得到了广泛应用。在重力模型应用中,结果对参数的敏感性较高,不同的参数设置就可能导致结果体系的巨大差异,故精确的参数是重力模型应用的基础。许多研究关注了重力模型参数的提取,但限于数据等因素,参数在空间上的差异性尚未得到充分的重视。本文采用2010年城市间铁路客运量作为城市间相互作用强度的反映,以城市市辖区居民总可支配收入作为城市的'质量',刻画城市本身的吸引力,进而通过回归分析考察重力模型的参数结果;并结合地理信息系统的空间插值工具,分析重力模型中各个参数的空间差异并得到可视化结果。相比于既有研究,本文在变量选取中增加了城市间列车交流频次这一变量,与平均运行时间结合共同反映城市之间的'距离',使模型拟合结果得到较大改进。结果表明,重力模型参数取值在空间上存在显著差异,对不同区域使用统一的重力模型参数可能使结果出现较大偏差,因此将重力模型应用到具体实践中时,不能忽略参数的空间异质性。
Spatial heterogeneity of gravity model parameters: A case study of inter-city railway passenger flow in China [J].https://doi.org/10.11820/dlkxjz.2014.12.009 URL [本文引用: 1] 摘要
重力模型是重要的空间相互作用模型,已经在相关研究和实践中得到了广泛应用。在重力模型应用中,结果对参数的敏感性较高,不同的参数设置就可能导致结果体系的巨大差异,故精确的参数是重力模型应用的基础。许多研究关注了重力模型参数的提取,但限于数据等因素,参数在空间上的差异性尚未得到充分的重视。本文采用2010年城市间铁路客运量作为城市间相互作用强度的反映,以城市市辖区居民总可支配收入作为城市的'质量',刻画城市本身的吸引力,进而通过回归分析考察重力模型的参数结果;并结合地理信息系统的空间插值工具,分析重力模型中各个参数的空间差异并得到可视化结果。相比于既有研究,本文在变量选取中增加了城市间列车交流频次这一变量,与平均运行时间结合共同反映城市之间的'距离',使模型拟合结果得到较大改进。结果表明,重力模型参数取值在空间上存在显著差异,对不同区域使用统一的重力模型参数可能使结果出现较大偏差,因此将重力模型应用到具体实践中时,不能忽略参数的空间异质性。
|
| [11] |
Evaluating the friction of distance parameter in gravity models [J].https://doi.org/10.1080/09595237400185281 URL [本文引用: 1] 摘要
Cliff A. D., Martin R. L. and Ord J. K. (1974) Evaluating the friction of distance parameter in gravity models, Reg. Studies 8, 281 286. In this paper we consider whether map pattern (spatial autocorrelation) among the population values in constrained and unconstrained gravity models calibrated by least squares regression hinders interpretation of the coefficient of the distance term. It is shown that, except in certain cases which are most likely to occur in intra-, rather than inter-, urban models, no real problem of interpretation should arise. This finding differs to some extent from those of Curry (1972) and Johnston (1973). The conclusions are supported by both theoretical and empirical results.
|
| [12] |
Spatial interaction and network structure evolvement of cities in terms of China's rail passenger flows [J]. |
| [13] |
Spatial structure and spatial interaction: 25 years later [J].https://doi.org/10.1068/a080731 URL [本文引用: 1] 摘要
In the 1970s, spatial autocorrelation (i.e., local distance and configuration effects) and distance decay (i.e., global distance effects) were suspected of being intermingled in spatial interaction model specifications. This convolution was first treated in a theoretical context by Curry (1972), with some subsequent debate (e.g., Curry, Griffith, and Sheppard 1975). This work was followed by a documentation of the convolution (e.g., Griffith and Jones 1980) and further theoretical treatment of the role spatial autocorrelation plays in spatial interaction modeling (e.g., Griffith 1982). But methodology did not exist at the time--or even soon thereafter--to easily or fully address spatial autocorrelation effects within spatial interaction model specifications, a contention attested to and demonstrated by the cumbersome and difficult-to-implement techniques employed by, for example, Bolduc, Laferriere, and Santarossa (1992, 1995) and Bolduc, Fortin, and Gordon (1997). Today, however, eigenfunction-based spatial filtering offers a methodology that can account for spatial autocorrelation effects within a spatial interaction model. This paper updates work from the early 1980s, extending it with spatial filtering methods.
|
| [14] |
Geo-located twitter as proxy for global mobility patterns [J].https://doi.org/10.1080/15230406.2014.890072 URL PMID: 4786829 [本文引用: 1] 摘要
Pervasive presence of location-sharing services made it possible for researchers to gain an unprecedented access to the direct records of human activity in space and time. This article analyses geo-located Twitter messages in order to uncover global patterns of human mobility. Based on a dataset of almost a billion tweets recorded in 2012, we estimate the volume of international travelers by country of residence. Mobility profiles of different nations were examined based on such characteristics as mobility rate, radius of gyration, diversity of destinations, and inflow utflow balance. Temporal patterns disclose the universally valid seasons of increased international mobility and the particular character of international travels of different nations. Our analysis of the community structure of the Twitter mobility network reveals spatially cohesive regions that follow the regional division of the world. We validate our result using global tourism statistics and mobility models provided by other authors and argue that Twitter is exceptionally useful for understanding and quantifying global mobility patterns.
|
| [15] |
|
| [16] |
Map pattern and friction of distance parameters: A comment [J].https://doi.org/10.1080/09595237500185291 URL [本文引用: 1] 摘要
This note maintains that a recent paper by Cliff, Martin and Ord is incorrect in its conclusions relevant to a paper by Johnston, as shown by data fitted to their hypothetical spatial system.
|
| [17] |
|
| [18] |
Understanding human mobility from twitter [J].https://doi.org/10.1371/journal.pone.0131469 URL PMID: 4496063 [本文引用: 1] 摘要
Understanding human mobility is crucial for a broad range of applications from disease prediction to communication networks. Most efforts on studying human mobility have so far used private and low resolution data, such as call data records. Here, we propose Twitter as a proxy for human mobility, as it relies on publicly available data and provides high resolution positioning when users opt to geotag their tweets with their current location. We analyse a Twitter dataset with more than six million geotagged tweets posted in Australia, and we demonstrate that Twitter can be a reliable source for studying human mobility patterns. Our analysis shows that geotagged tweets can capture rich features of human mobility, such as the diversity of movement orbits among individuals and of movements within and between cities. We also find that short- and long-distance movers both spend most of their time in large metropolitan areas, in contrast with intermediate-distance movers movements, reflecting the impact of different modes of travel. Our study provides solid evidence that Twitter can indeed be a useful proxy for tracking and predicting human movement.
|
| [19] |
A comparative analysis of intra-city human mobility by taxi [J].https://doi.org/10.1016/j.physa.2014.10.085 URL [本文引用: 1] 摘要
61We observe common patterns of human mobility by taxi in several cities.61The displacement distributions of taxi trips tend to follow exponential laws.61The trip durations follow log-normal distributions.61The interevent time distributions have log-normal bodies followed by power law tails.61Airports attract large amounts of taxi traffic at a certain distance level.
|
| [20] |
Understanding intra-urban trip patterns from taxi trajectory data [J].https://doi.org/10.1007/s10109-012-0166-z URL [本文引用: 1] 摘要
Intra-urban human mobility is investigated by means of taxi trajectory data that are collected in Shanghai, China, where taxis play an important role in urban transportation. From the taxi trajectories, approximately 1.5 million trips of anonymous customers are extracted on seven consecutive days. The globally spatio-temporal patterns of trips exhibit a significant daily regularity. Since each trip can be viewed as a displacement in the random walk model, the distributions of the distance and direction of the extracted trips are investigated in this research. The direction distribution shows an NEE–SWW-dominant direction, and the distance distribution can be well fitted by an exponentially truncated power law, with the scaling exponent β02=021.202±020.15. The observed patterns are attributed to the geographical heterogeneity of the study area, which makes the spatial distribution of trajectory stops to be non-uniform. We thus construct a model that integrates both the geographical heterogeneity and distance decay effect, to interpret the observed patterns. Our Monte Carlo simulation results closely match to the observed patterns and thus validate the proposed model. According to the proposed model, in a single-core urban area, the geographical heterogeneity and distance decay effect improve each other when influencing human mobility patterns. Geographical heterogeneity leads to a faster observed decay, and the distance decay effect makes the spatial distribution of trips more concentrated.
|
| [21] |
Analyzing relatedness by toponym co-occurrences on web pages [J].https://doi.org/10.1111/tgis.12023 URL 摘要
This research proposes a method for capturing 090008relatedness between geographical entities090009 based on the co-occurrences of their names on web pages. The basic assumption is that a higher count of co-occurrences of two geographical places implies a stronger relatedness between them. The spatial structure of China at the provincial level is explored from the co-occurrences of two provincial units in one document, extracted by a web information retrieval engine. Analysis on the co-occurrences and topological distances between all pairs of provinces indicates that: (1) spatially close provinces generally have similar co-occurrence patterns; (2) the frequency of co-occurrences exhibits a power law distance decay effect with the exponent of 0.2; and (3) the co-occurrence matrix can be used to capture the similarity/linkage between neighboring provinces and fed into a regionalization method to examine the spatial organization of China. The proposed method provides a promising approach to extracting valuable geographical information from massive web pages.
|
| [22] |
The laws of migration [J]. |
| [23] |
Distance transformation and distance decay function [J].https://doi.org/10.1111/j.1538-4632.1971.tb00364.x URL [本文引用: 1] 摘要
ABSTRACT Inadequate habits in the consumption of food that contains calcium causes dietary misbalances which drive to health problems, such as osteoporosis. Calcium is a vital element for the body, and its existence in it depends exclusively on its consumption in the diet. Consumer awareness about health problems has driven companies to develop food with calcium additions, aiming to make them a part of the feeding routine, innovating products or improving the quality of those that already exist with a higher added value. For these developments it is important to get familiar with some parameters mentioned in this article.
|
| [24] |
|
| [25] |
Geography: A discipline in distance [J].https://doi.org/10.1080/00369225508735583 URL [本文引用: 1] 摘要
Generalized Geography is an impartial two-person game played on a digraph =(,). In impartial Arc (Vertex) Geography, a token is initially placed on a special start vertex, and the players alternately move the token along unused arcs (vertices) of . The player first unable to move loses and his opponent wins. The question of who wins these games IAG and IVG is known to be PSPACE-complete.Both impartial versions with tokens on special start vertices are proved PSPACE-complete even for DAGs but polynomial for directed trees. The partizan variations, PAG and PVG, with one token per player are PSPACE-complete even for bipartite degree-restricted digraphs. They are NP-hard for DAGs, but polynomial for directed trees.
|
| [26] |
Statistical theory of spatial trip distribution models [J].https://doi.org/10.1016/0041-1647(67)90035-4 URL [本文引用: 1] 摘要
It is now widely believed that in the short-term retention of verbal material, both primary memory (PM) and secondary memory (SM) mechanisms are involved. In the experiments reported here an attempt was made to separate the PM and SM components in immediate free recall. The first experiment showed that neither age nor the size of set from which words were drawn affected the size of the PM component but that both factors affected retrieval from SM. The second experiment showed that word length affected neither the PM nor the SM component. It was concluded that PM stores a constant number of words regardless of word length.
|
| [27] |
Reconstructing gravitational attractions of major cities in China from air passenger flow data, 2001-2008: A particle swarm optimization approach [J]. |

/
| 〈 |
|
〉 |


